
In this tutorial, we will show you how to use JMeter with Neocortix LoadTest to run distributed load tests.
We assume you have already signed up for a Neocortix Cloud Services account.
Please download the LoadTest Example Files, unzip it, and you will find a directory
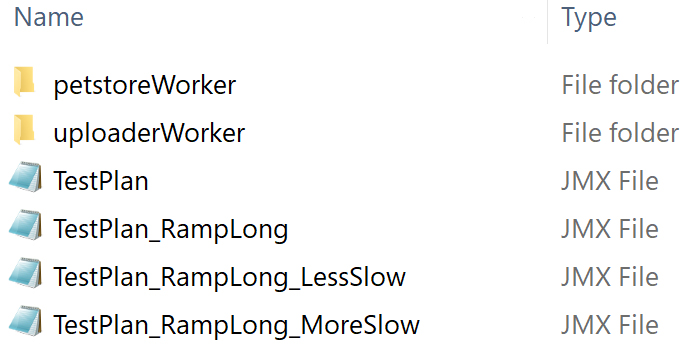
LoadTestFiles
with the following JMeter .jmx files and data directories:
You will use those files to run the various examples below.
Running Your First Load Test
Please go to the LoadTest dashboard at
https://cloud.neocortix.com/load-test:
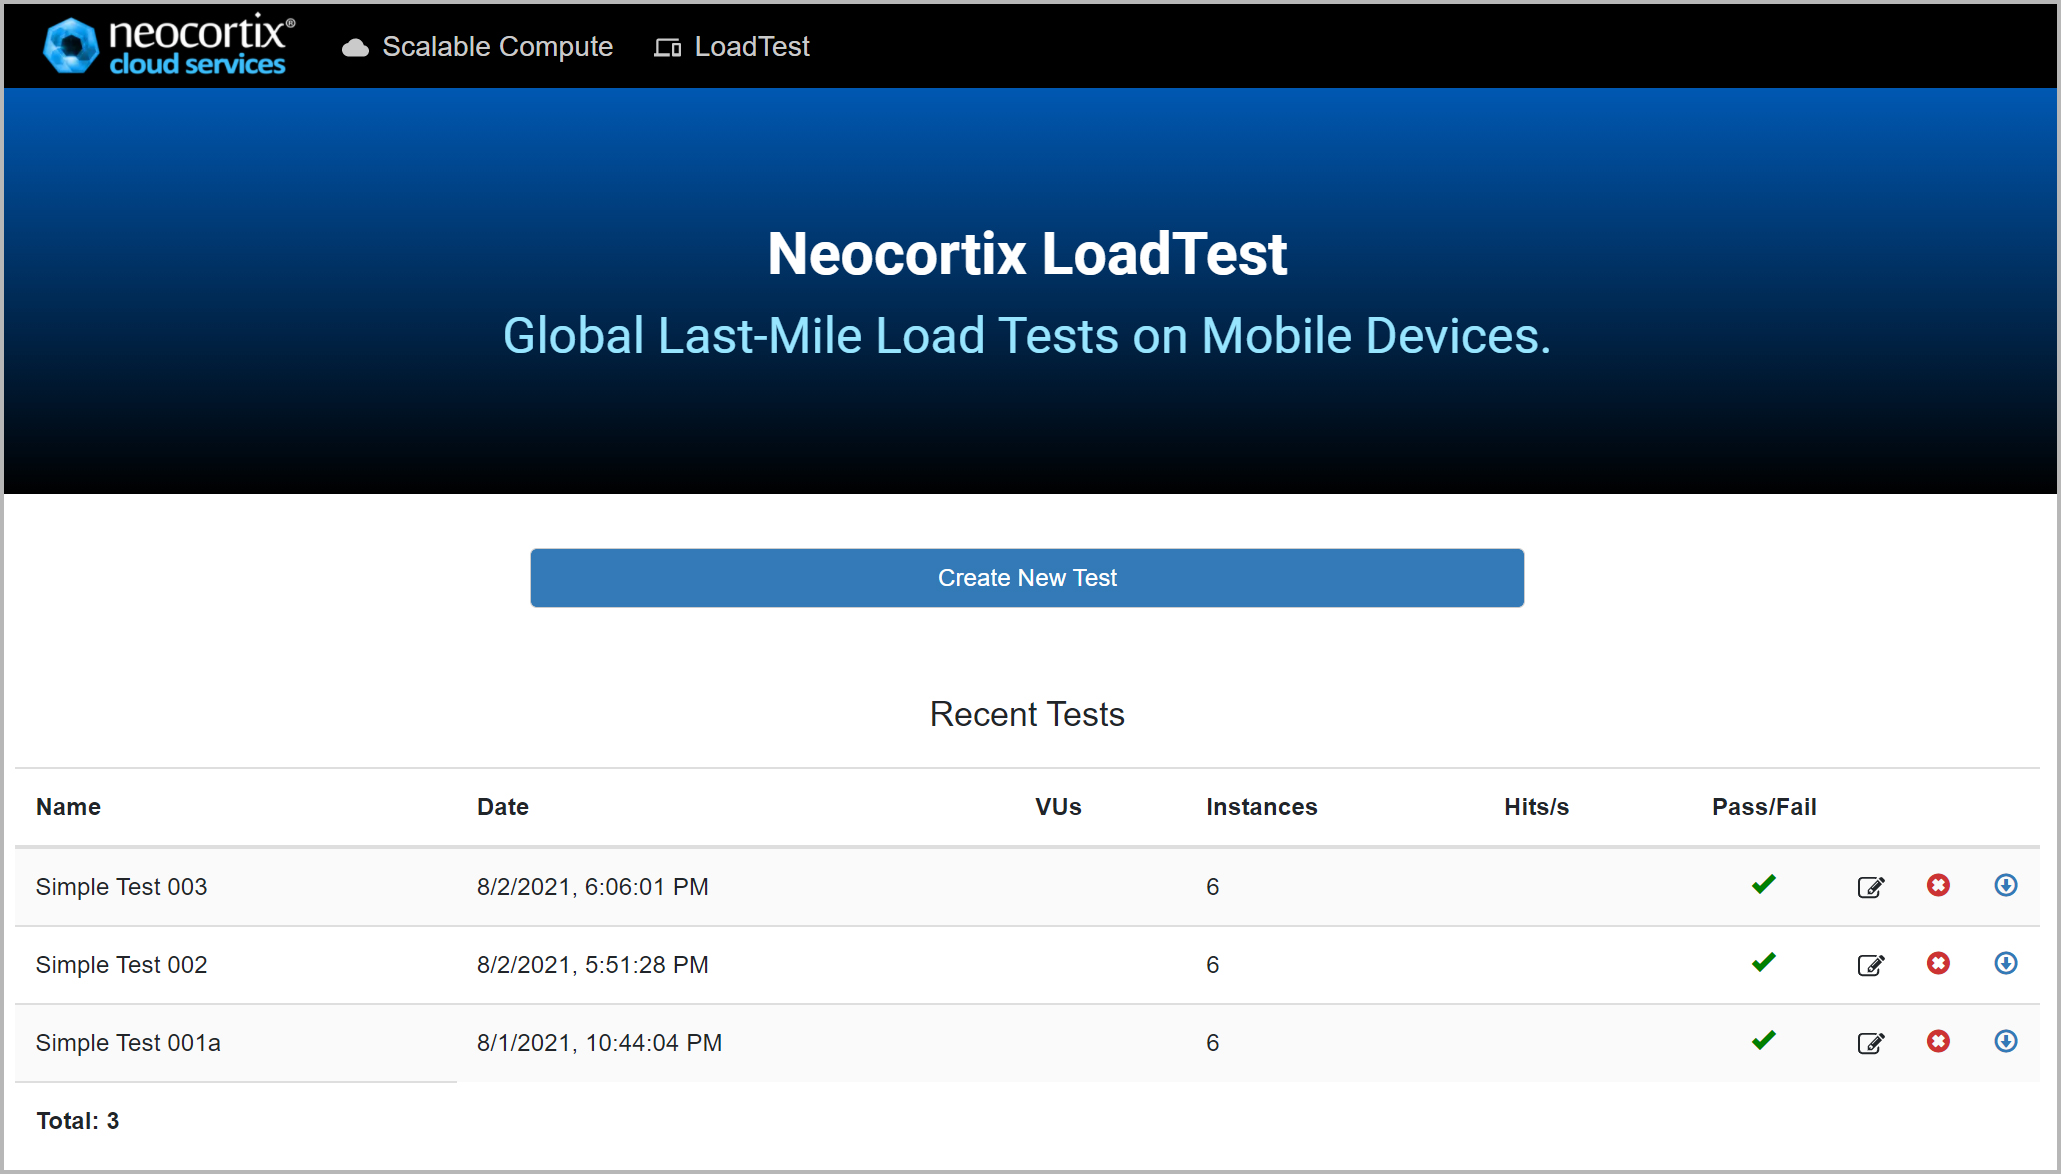
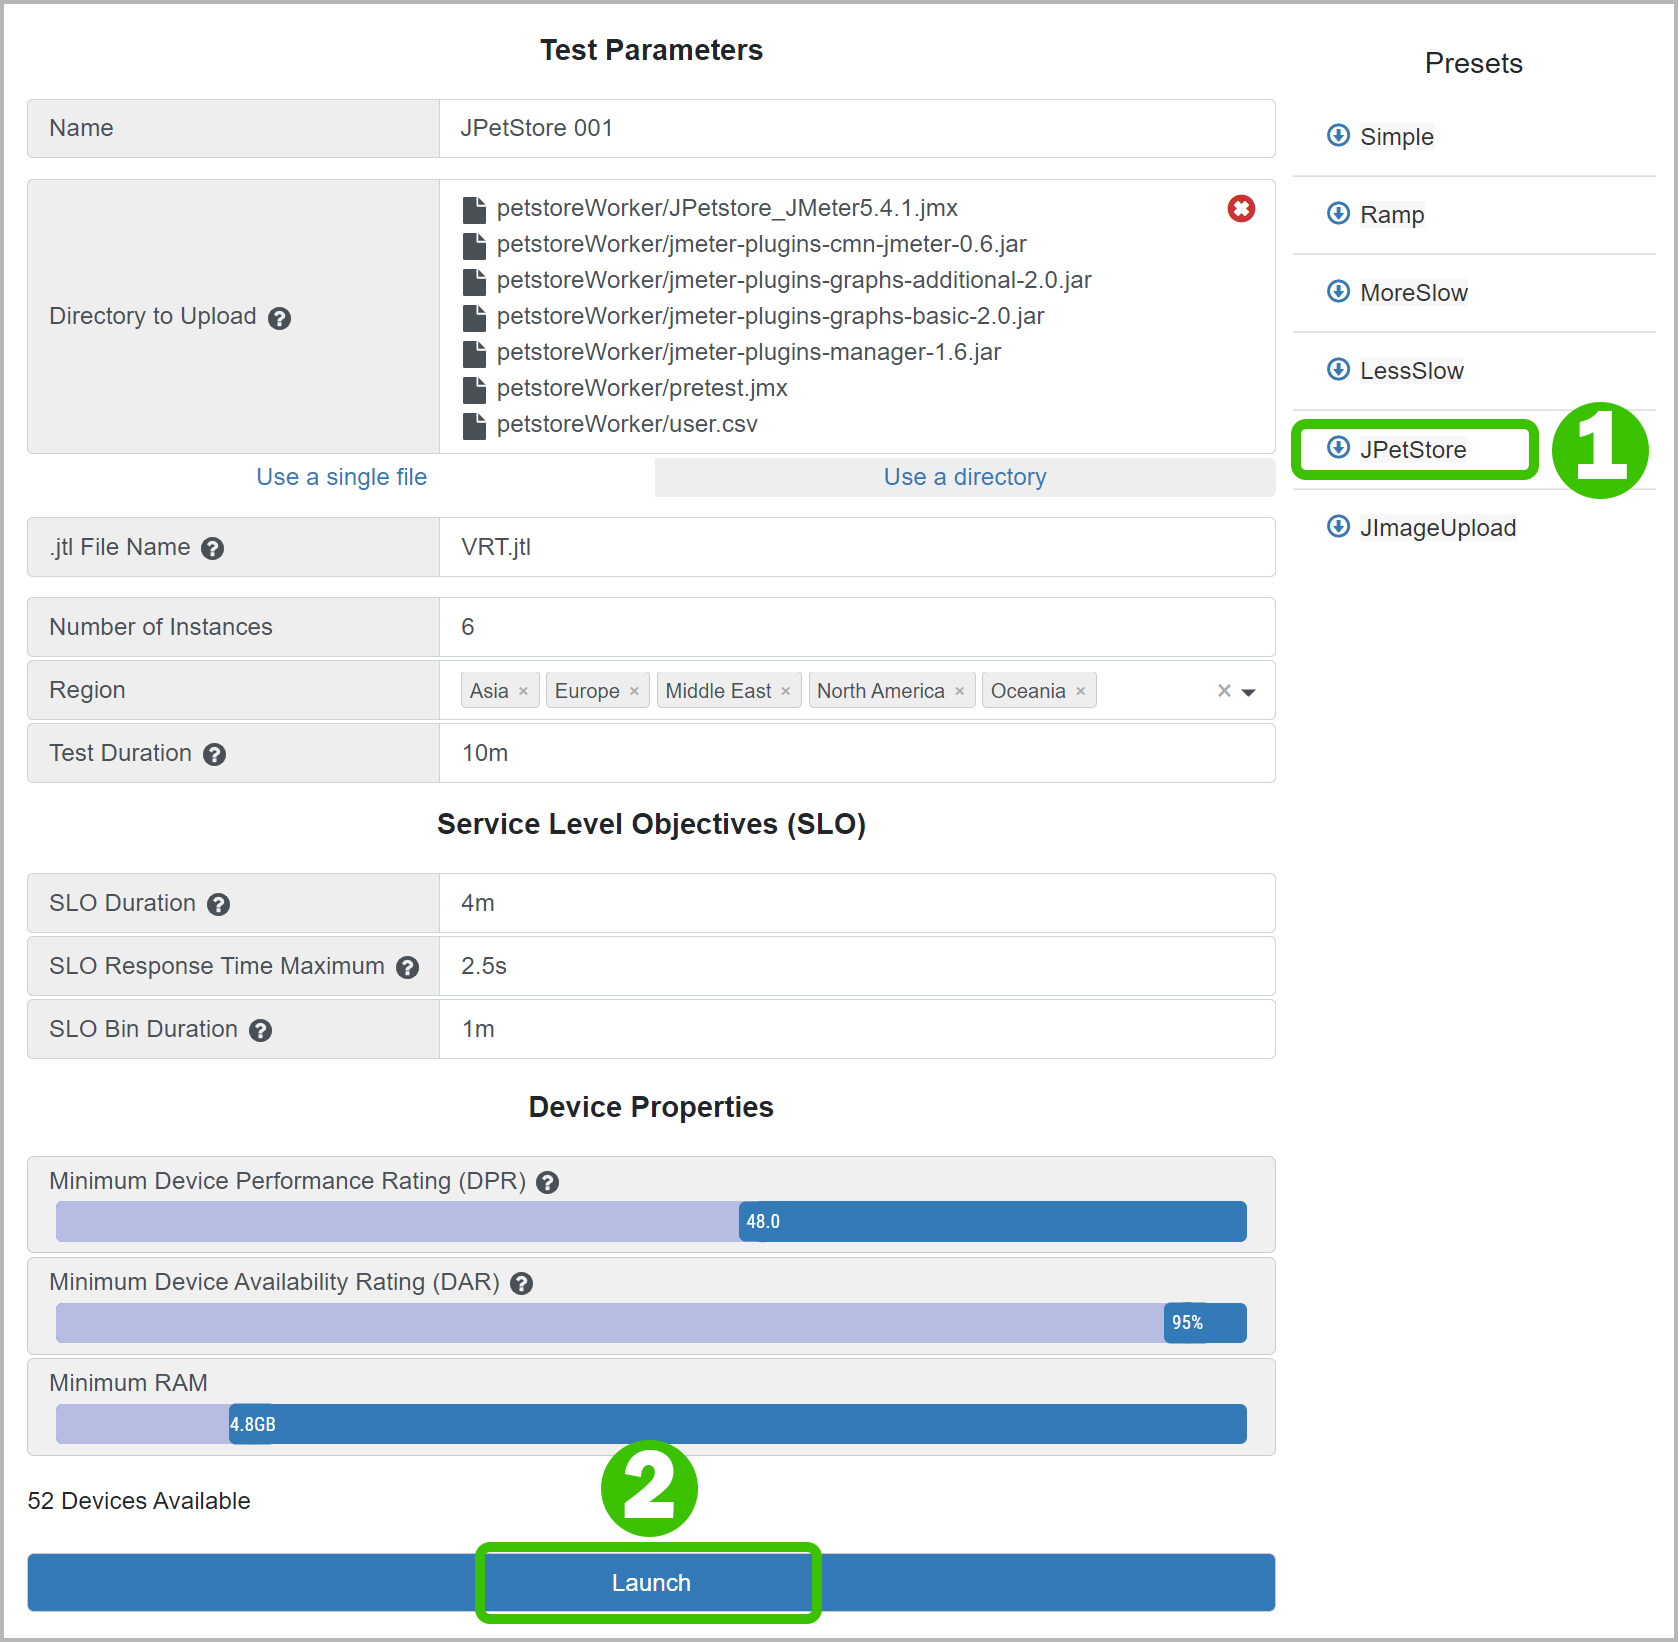
Please click on the button "Create New Test", which will take you to the LoadTest Launch Page. With only two clicks, you can select one of our Preset Examples and Launch your first test, as shown below:
Or you can follow these instructions below to upload files for a test:
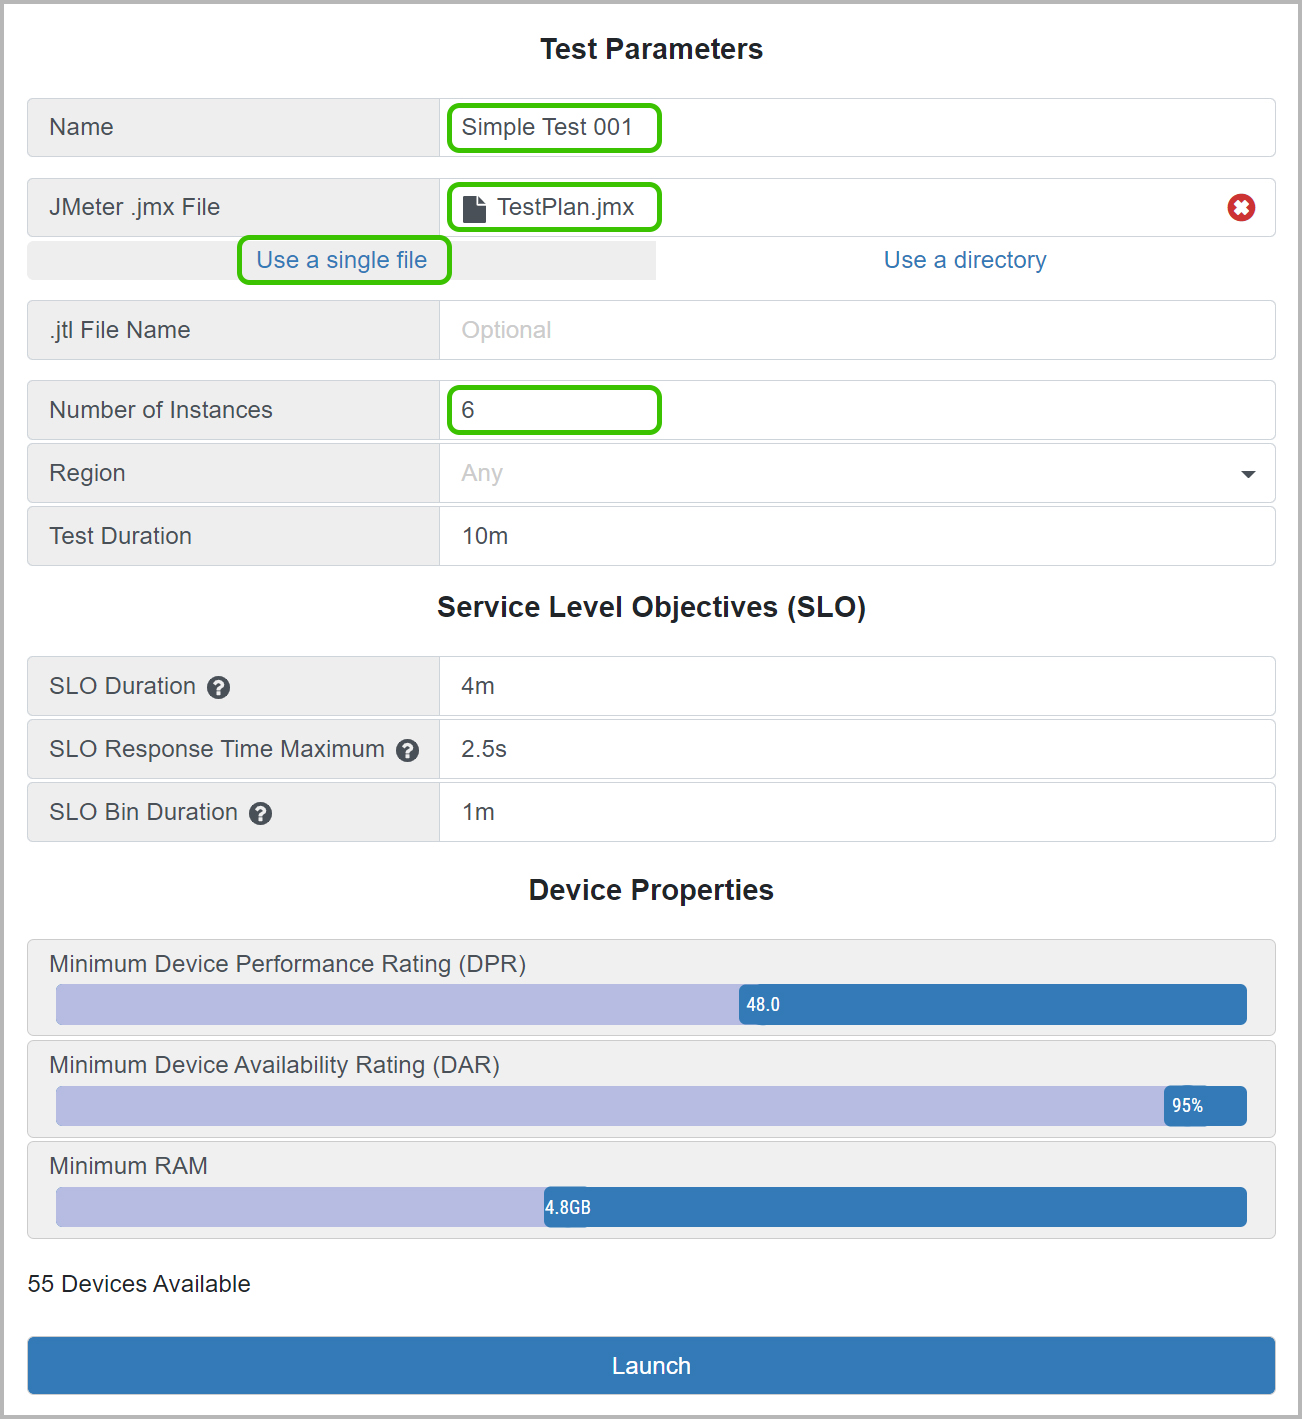
In the example above, we have given our test a Name ("Simple Test 001"). By default, "Use a single file" is selected, as needed for these simple examples. We have chosen a JMeter .jmx File, by clicking on the field "Select .jmx file" and choosing the file "TestPlan.jmx" from the files we downloaded from above. We have left everything else with its default value. Notice that the Number of Instances is left with its default value of 6; in some of the later examples, we suggest that you ask for 30 instances. Now just click on the "Launch" button, to start your first Global Last-Mile Load Test.
Please click on the button "Create New Test", which will take you to the LoadTest Launch Page. With only two clicks, you can select one of our Preset Examples and Launch your first test, as shown below:
Or you can follow these instructions below to upload files for a test:
In the example above, we have given our test a Name ("Simple Test 001"). By default, "Use a single file" is selected, as needed for these simple examples. We have chosen a JMeter .jmx File, by clicking on the field "Select .jmx file" and choosing the file "TestPlan.jmx" from the files we downloaded from above. We have left everything else with its default value. Notice that the Number of Instances is left with its default value of 6; in some of the later examples, we suggest that you ask for 30 instances. Now just click on the "Launch" button, to start your first Global Last-Mile Load Test.
It will take about 5 minutes for this small Load Test to run. When it is done, the page will look like this:
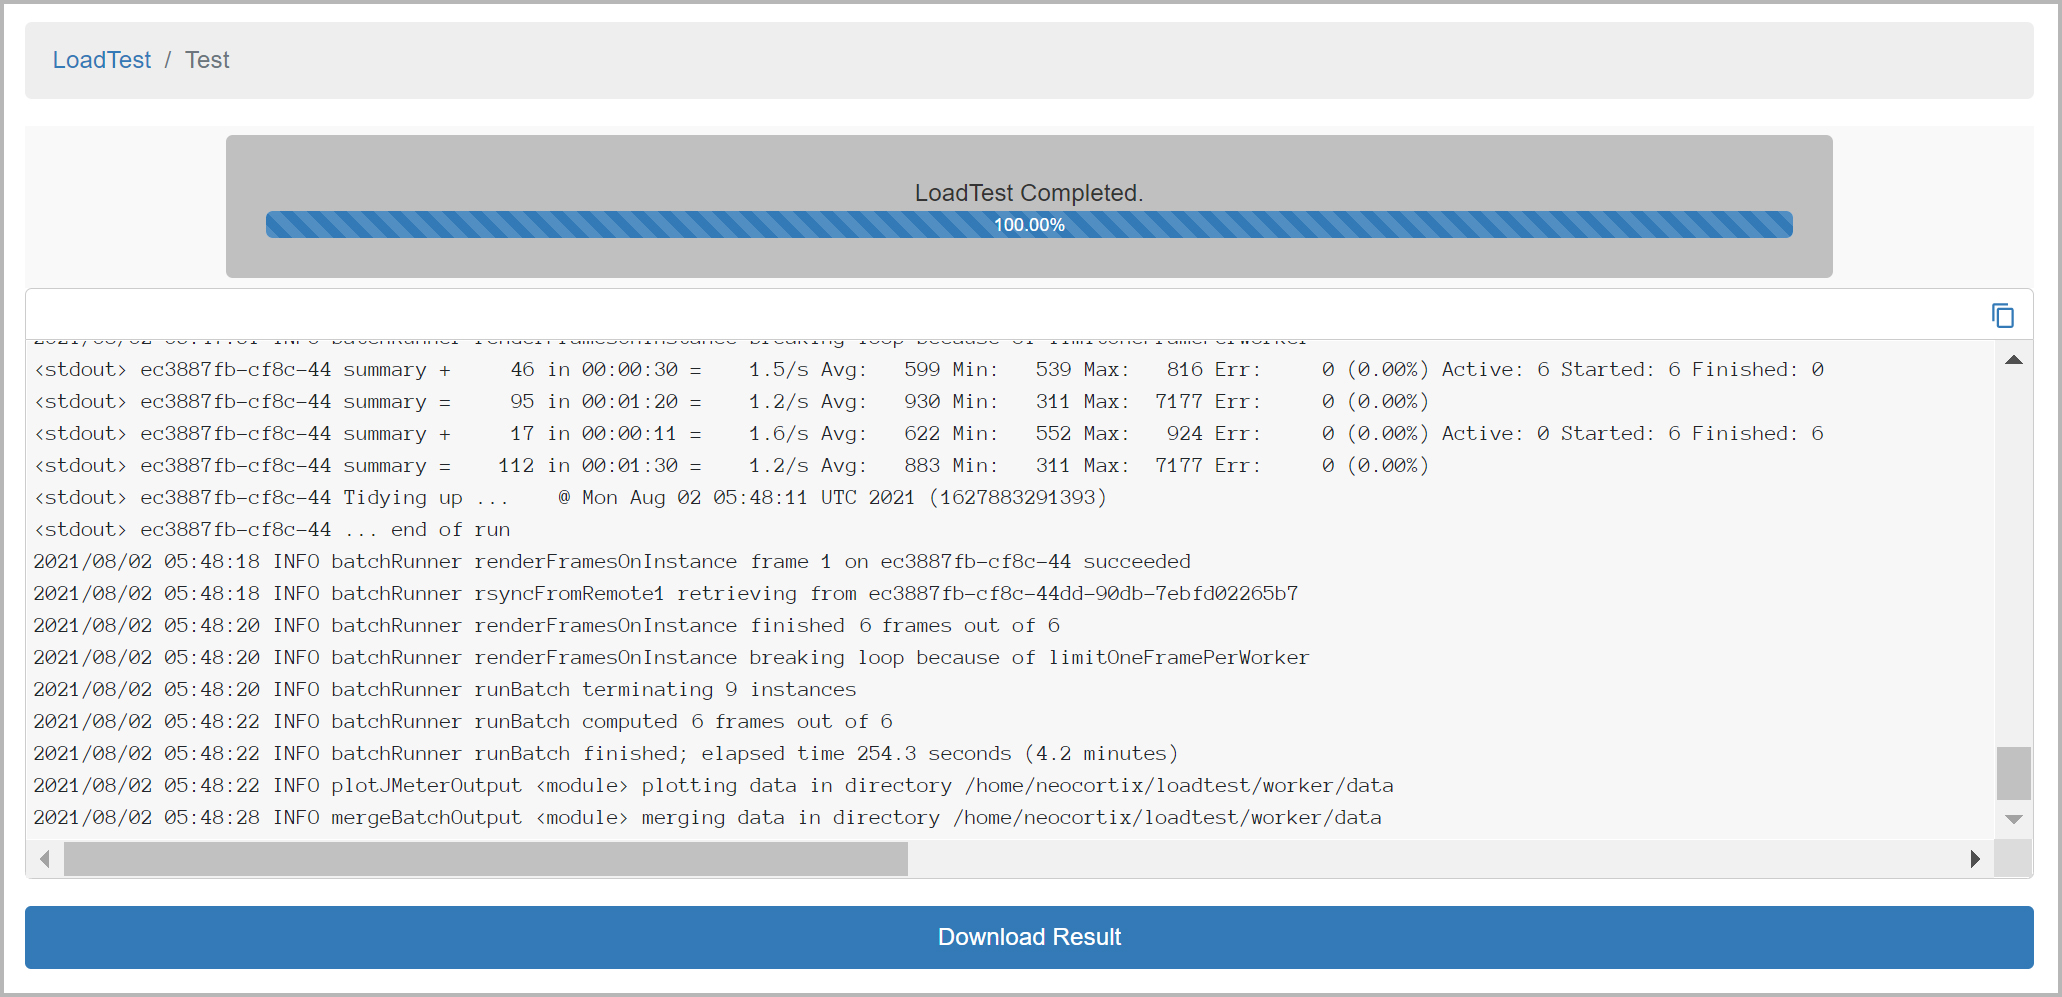
Please click on the "Download Results" button to download a .zip file of your test results. This will include the output files
Please click on the "Download Results" button to download a .zip file of your test results. This will include the output files
TestPlan_results_<n>.csv
, WorldMap.png
,
DeliveredLoad.png
, ResponseTimesByRegion.png
,
graphs2.png
,
graphs3.png
,
histogram2.png
,
SLOcomparison.png
,
TestResults.html
,
trackedStderr.log
, etc.
TestResults.html
provides a graphical summary of all of the results, shown here for the TestPlan_RampLong.jmx
example with 30 instances:
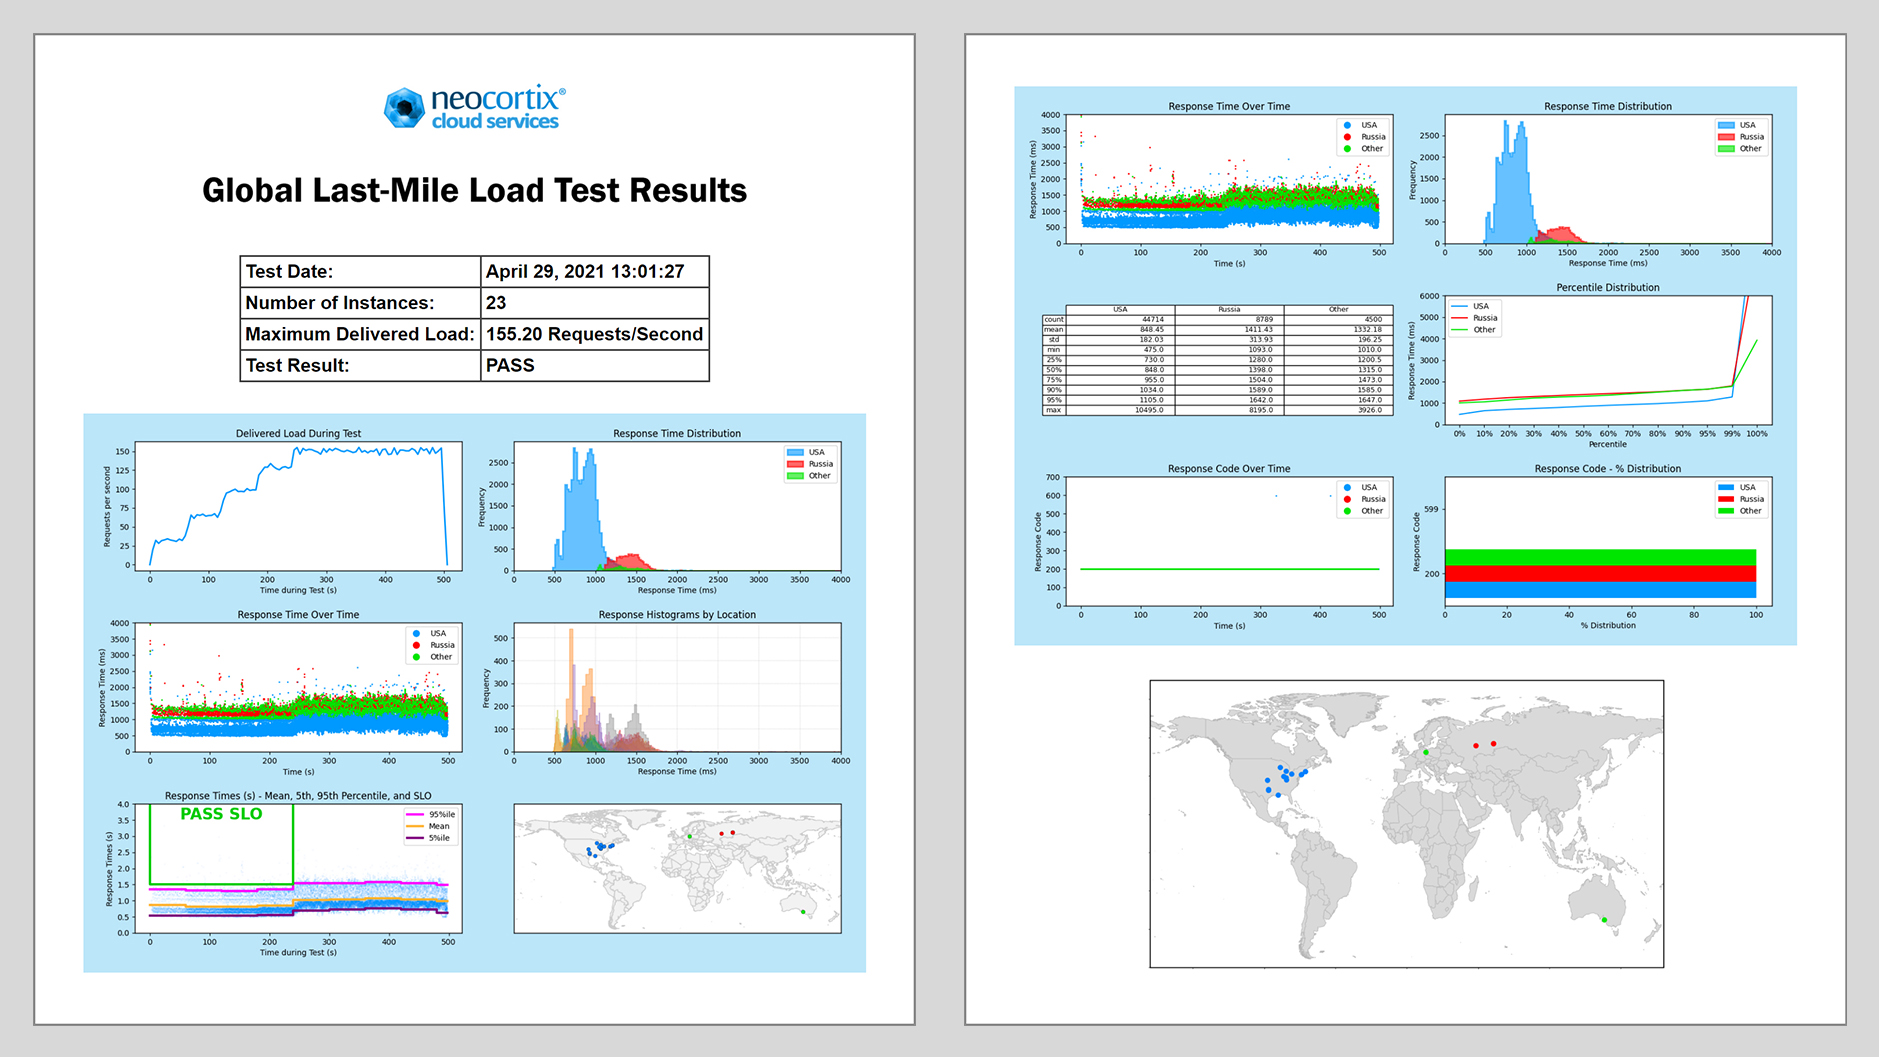
Thanks to our friend
Harinder Seera
for sharing his
code for several of the beautiful plots.
And finally, we produce
testResults.xml
, which can be used to return PASS/FAIL results to CI/CD Automation tools, such as CircleCI Orbs or Jenkins Plug-Ins.
Running Other Examples
We include the following examples in the LoadTestFiles.zip file (and in the Preset Examples), and we suggest that you try them all at least once:
-
TestPlan.jmx, which does a 90 second simple Load Test. Try it with 6 instances.
-
TestPlan_RampLong.jmx, which does a 500 second Load Test, with a 5-step ramp at 60 seconds for each step. Try it with 30 instances.
-
TestPlan_RampLong_MoreSlow.jmx, which does a 500 second Load Test, with a 5-step ramp at 60 seconds for each step, with a realistic Load Test target which has poor performance and is expected to fail the Service Level Objective (SLO). Try it with 30 instances.
-
TestPlan_RampLong_LessSlow.jmx, which does a 500 second Load Test, with a 5-step ramp at 60 seconds for each step, with a realistic Load Test target which has better performance and is expected to PASS the Service Level Objective (SLO). Try it with 30 instances.
Example Outputs with a Realistic Target
We also include
TestPlan_RampLong_MoreSlow.jmx
, which does a 500 second Load Test with 30 devices with a 5-step ramp at 60 seconds
for each step, hitting a load test target that takes about 1 second to respond and does some CPU-intensive work, representing an unoptimized server.
Here is an example output
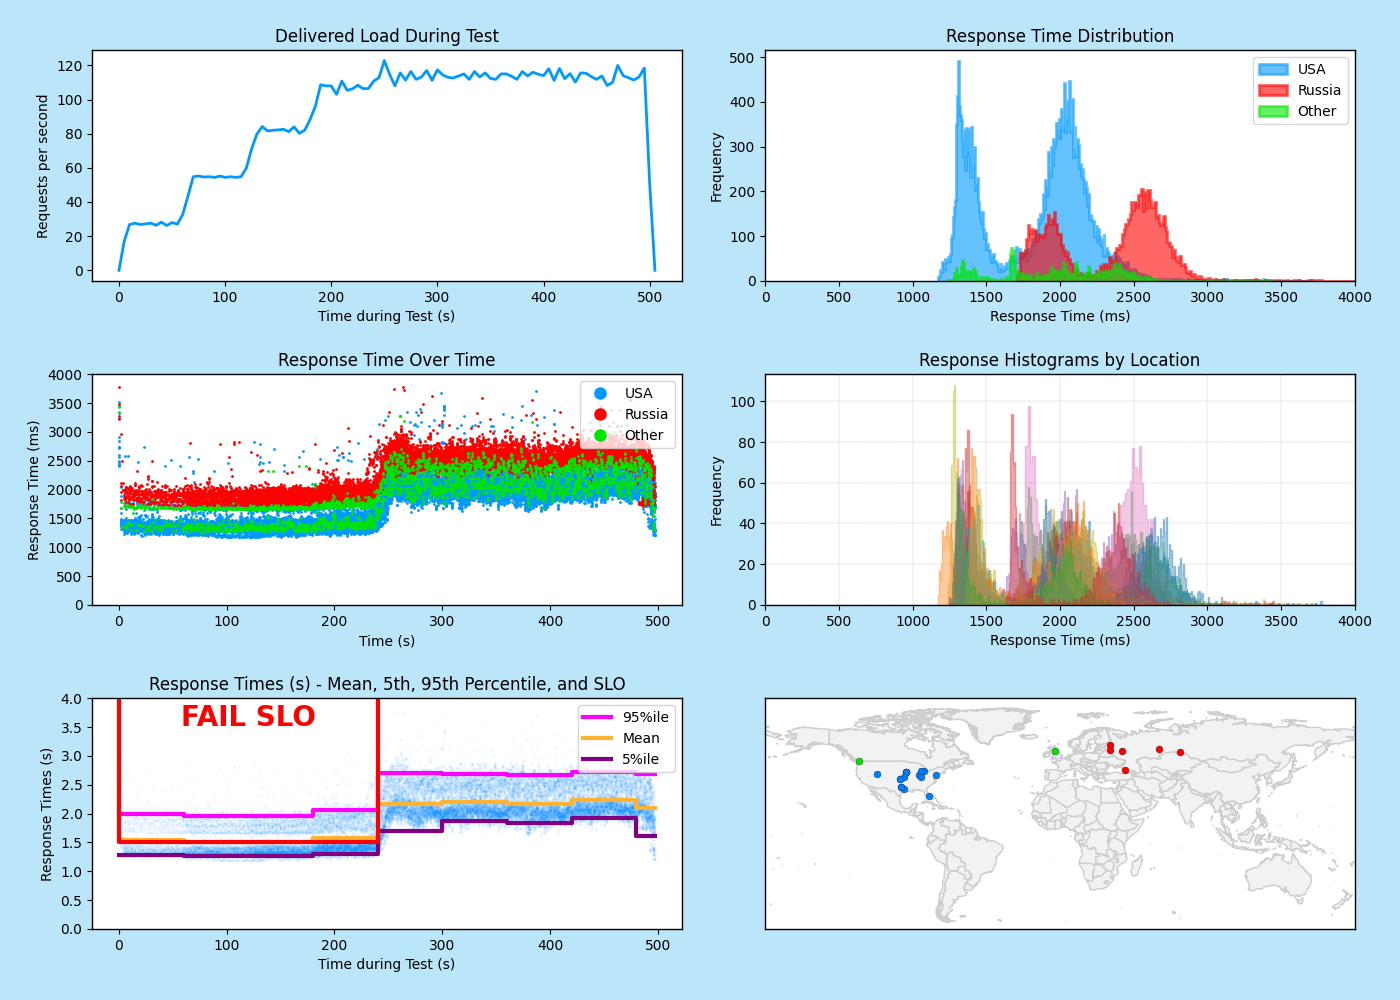
graphs3.png
,
which shows that the server does not meet the Service Level Objective (SLO) that the 95th percentile of response times as seen by the end-user should be less than 1.5s for the first four 60-second steps of the ramp:
We also include
TestPlan_RampLong_LessSlow.jmx
, which does a 500 second Load Test with 30 devices with a 5-step ramp at 60 seconds
for each step, hitting a load test target that takes about 0.3 second to respond and does somewhat less CPU-intensive work, representing a better-optimized server.
Here is an example output
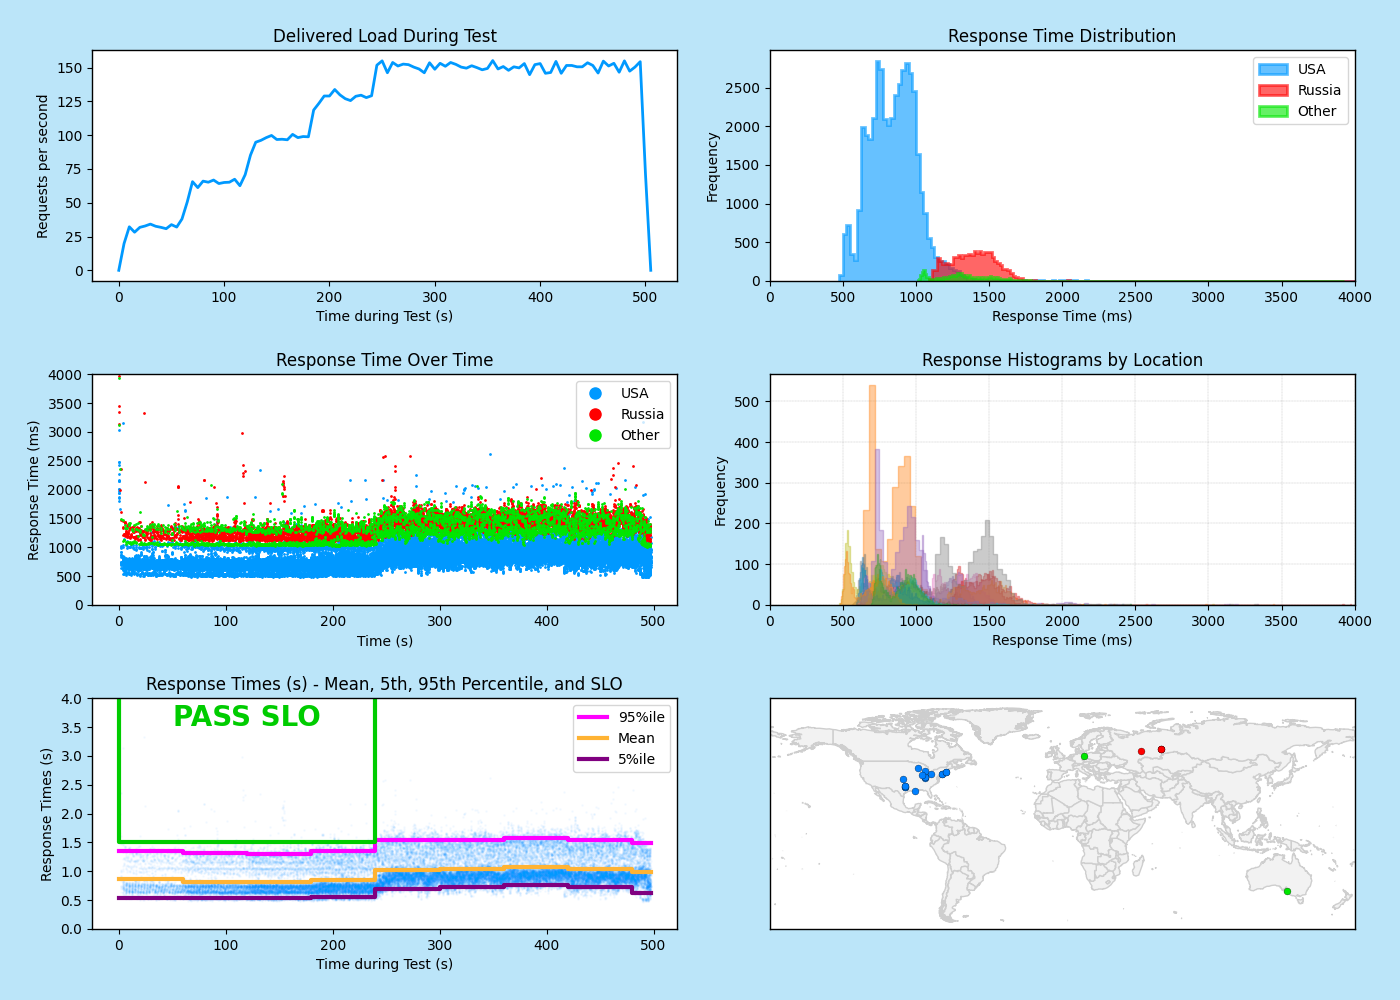
graphs3.png
,
which shows that the server does meet the Service Level Objective (SLO) that the 95th percentile of response times as seen by the end-user should be less than 1.5s for the first four 60-second steps of the ramp: