
In this tutorial, we will show you how to use Neocortix Cloud Services Scalable Compute to run a distributed LoadTest batch job, using a JMeter
client.
First, please follow the steps in the tutorial Setting Up For Batch Jobs. After completion of the initial setup, you will have a directory with examples,
~/ncsexamples
.
In the subdirectory 
~/ncsexamples/batchMode
you will find the runBatchJMeter.py command.
This script creates a set of instances running on mobile devices, one instance for each load generator.
In the default example provided, we ask for 6 successful instances:
startFrame = 1,
endFrame = 6,
nWorkers = 10,
By setting
nWorkers = 10
, we slightly over-allocate instances to allow for some fraction to fail.
It will command the instances to install JMeter, and then run JMeter with a short (90 seconds) and simple
TestPlan.jmx
to send http
requests to the target URL (currently https://loadtest-target.neocortix.com
):
def frameCmd( self, frameNum ):
cmd = 'date && apache-jmeter-5.3/bin/jmeter -n -t %s -l TestPlan_results_%03d.csv -D httpclient4.time_to_live=1 -D httpclient.reset_state_on_thread_group_iteration=true' % (
self.JMeterFilePath, frameNum
)
return cmd
The output of each instance will be
a .csv file
TestPlan_result_<n>.csv
containing request response timing information for each worker. The master will create several
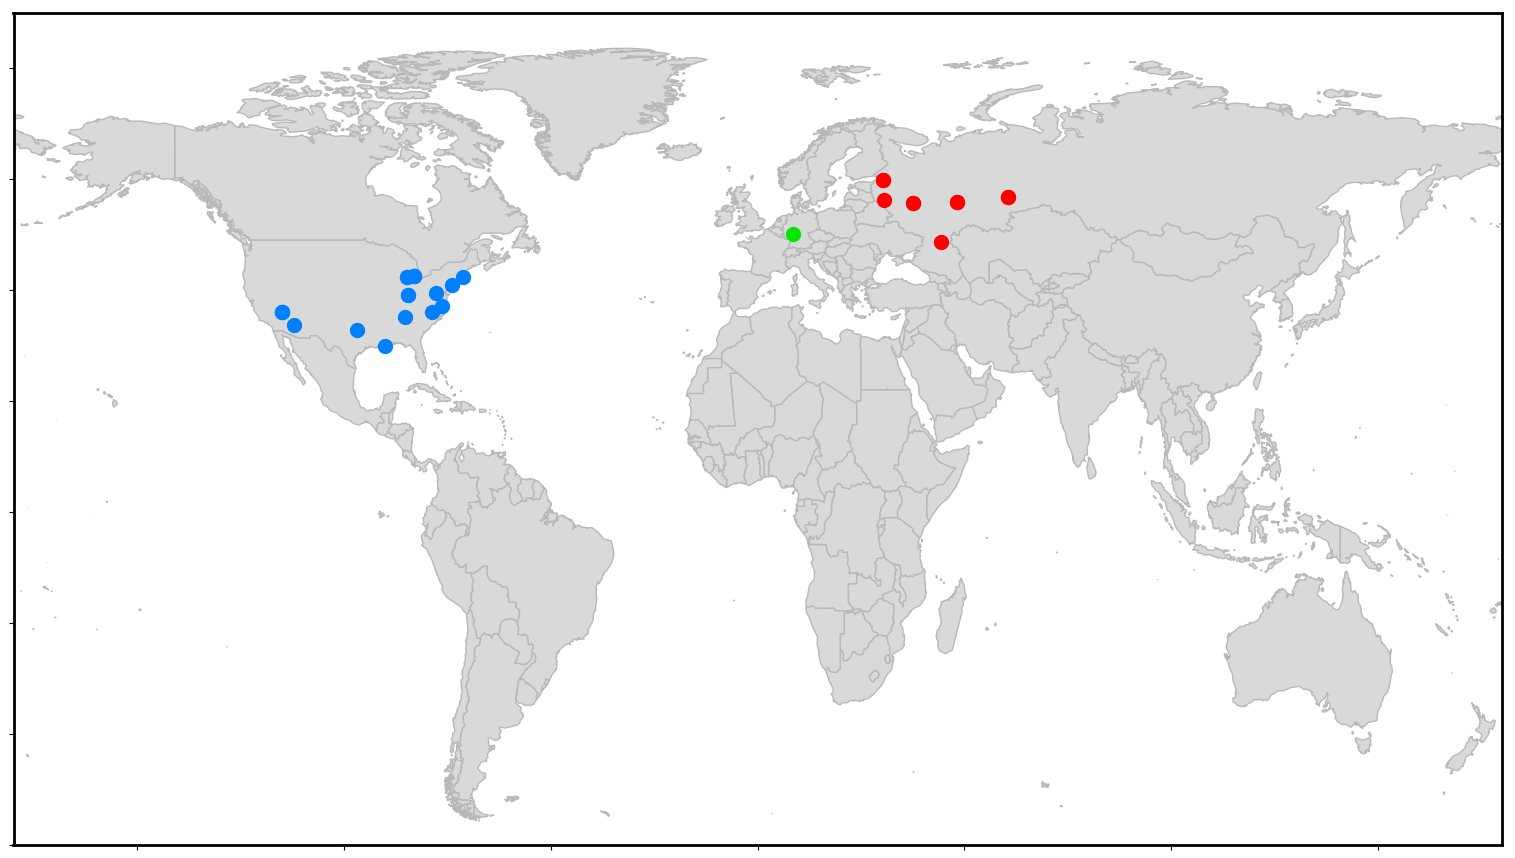
image and output files WorldMap.png
, DeliveredLoad.png
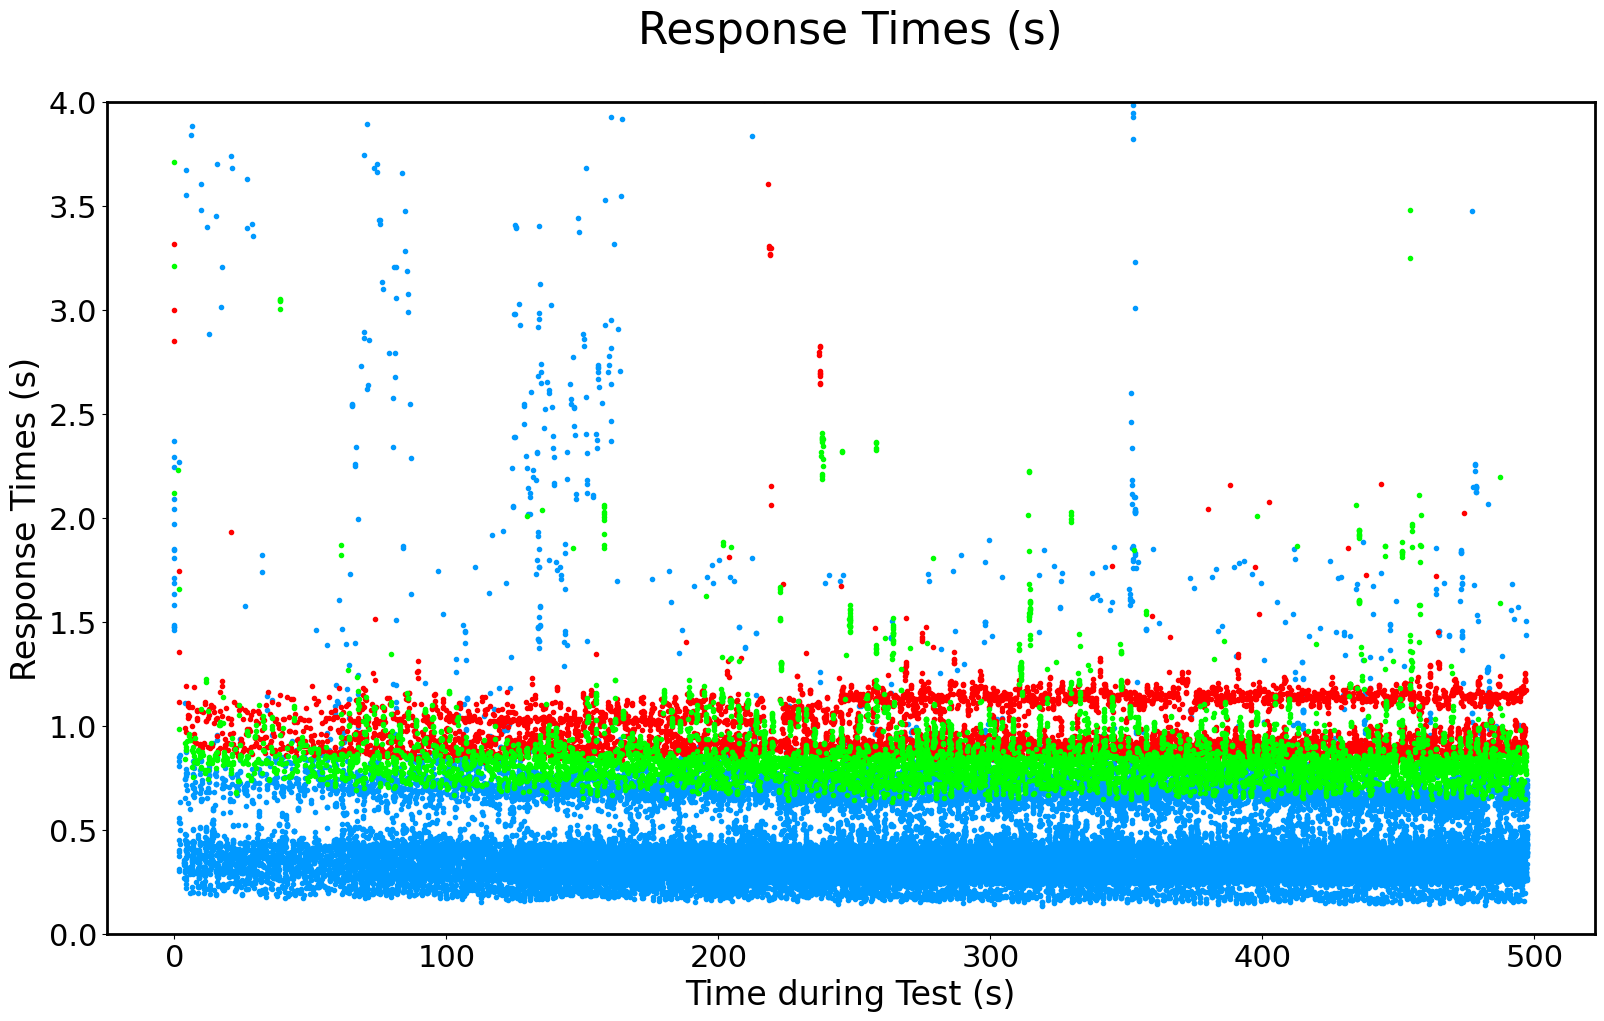
, ResponseTimesByRegion.png
,
graphs2.png
,
graphs3.png
,
histogram2.png
,
SLOcomparison.png
,
TestResults.html
,
and then terminate the instances.
Example Command
Simply run
When the program is done, the output files
./runBatchJMeterAll.sh
TestPlan_results_<n>.csv
, WorldMap.png
,
DeliveredLoad.png
, ResponseTimesByRegion.png
,
graphs2.png
,
graphs3.png
,
histogram2.png
,
SLOcomparison.png
,
TestResults.html
,
trackedStderr.log
,
will be put in a directory
./data/jmeter_<datestamp>
Running a Longer Ramped Load Test
We also include Here are example outputs:
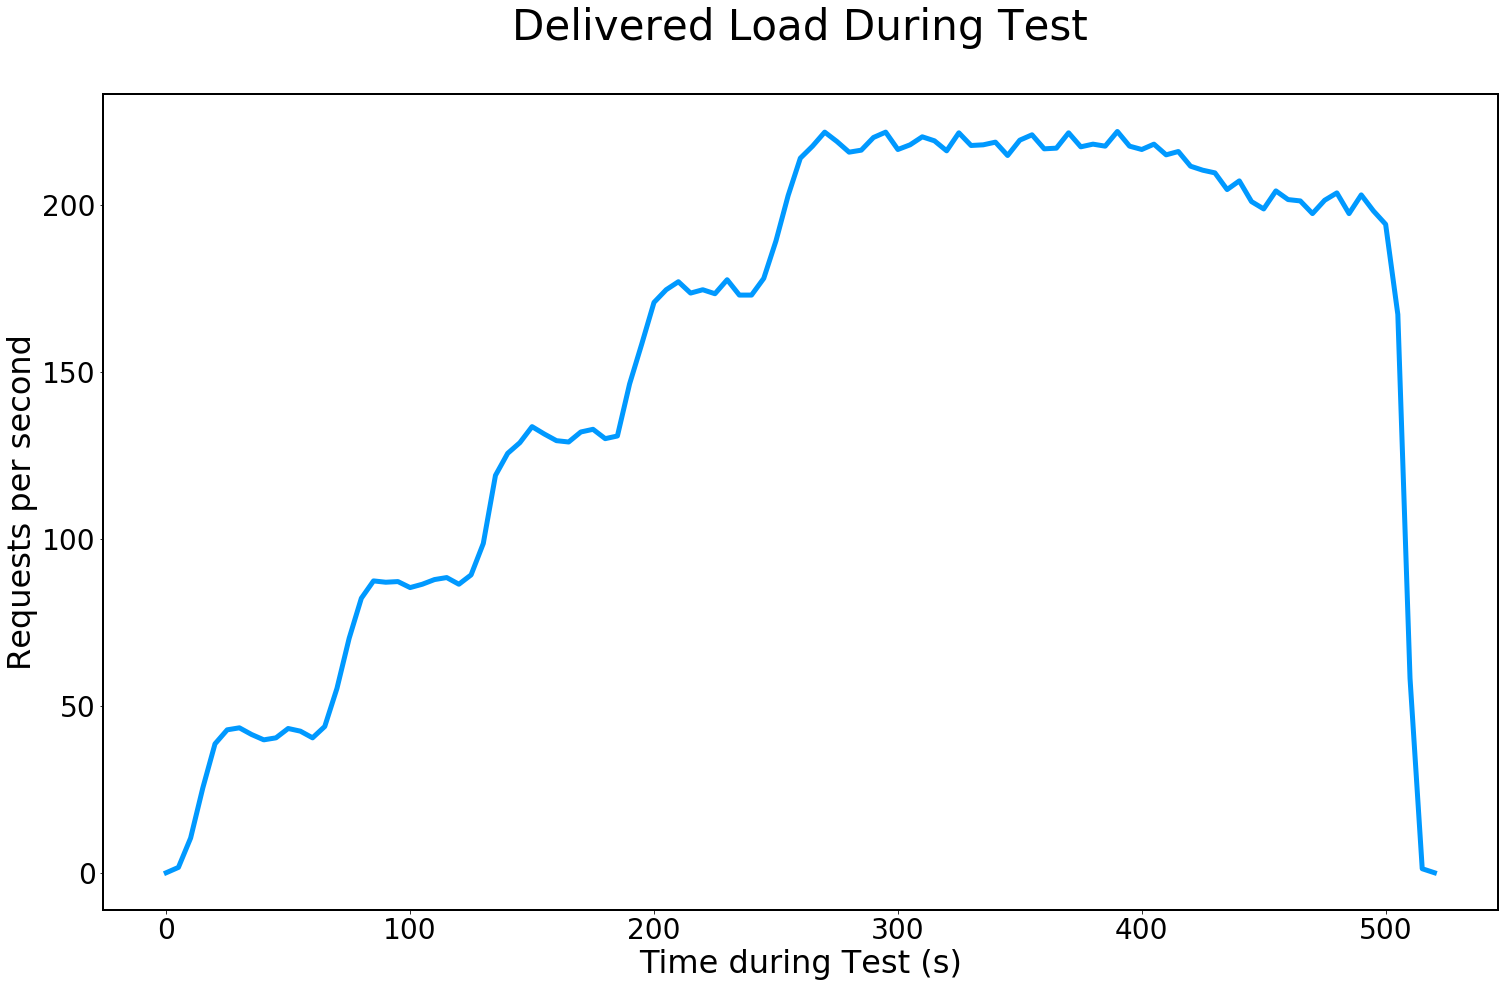
TestPlan_RampLong.jmx
, which does a 500 second Load Test with 30 devices with a 5-step ramp at 60 seconds
for each step. Just edit runBatchJMeter.py
and substitute TestPlan_RampLong.jmx
for
TestPlan.jmx
, and set endFrame = 30, nWorkers = 54
, and re-run
./runBatchJMeterAll.sh
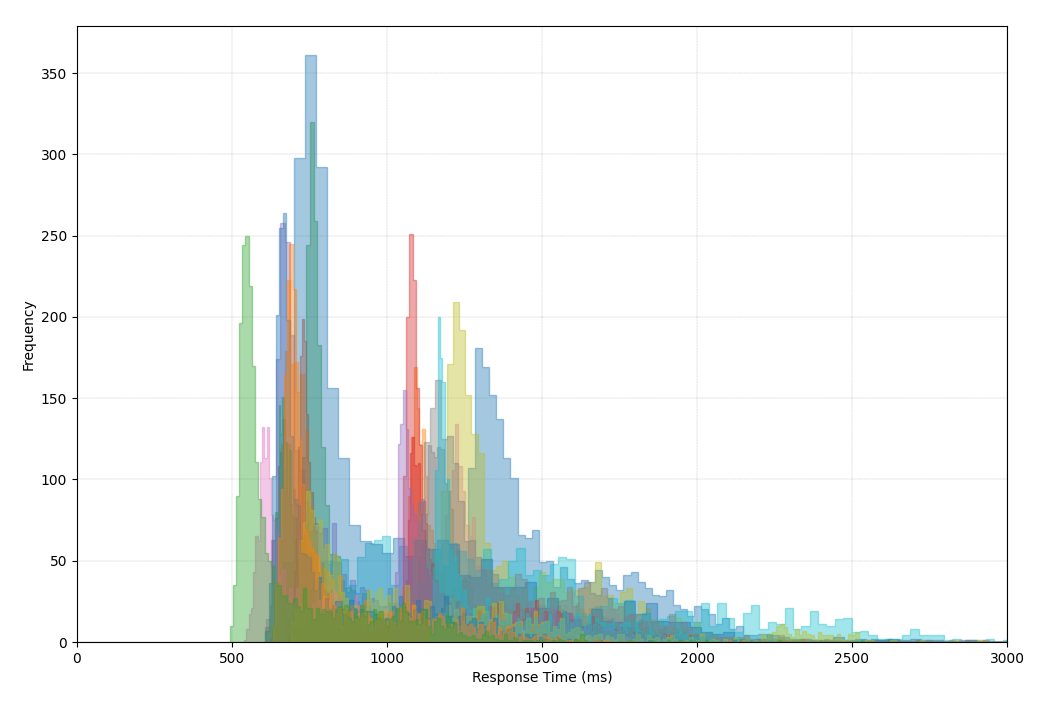
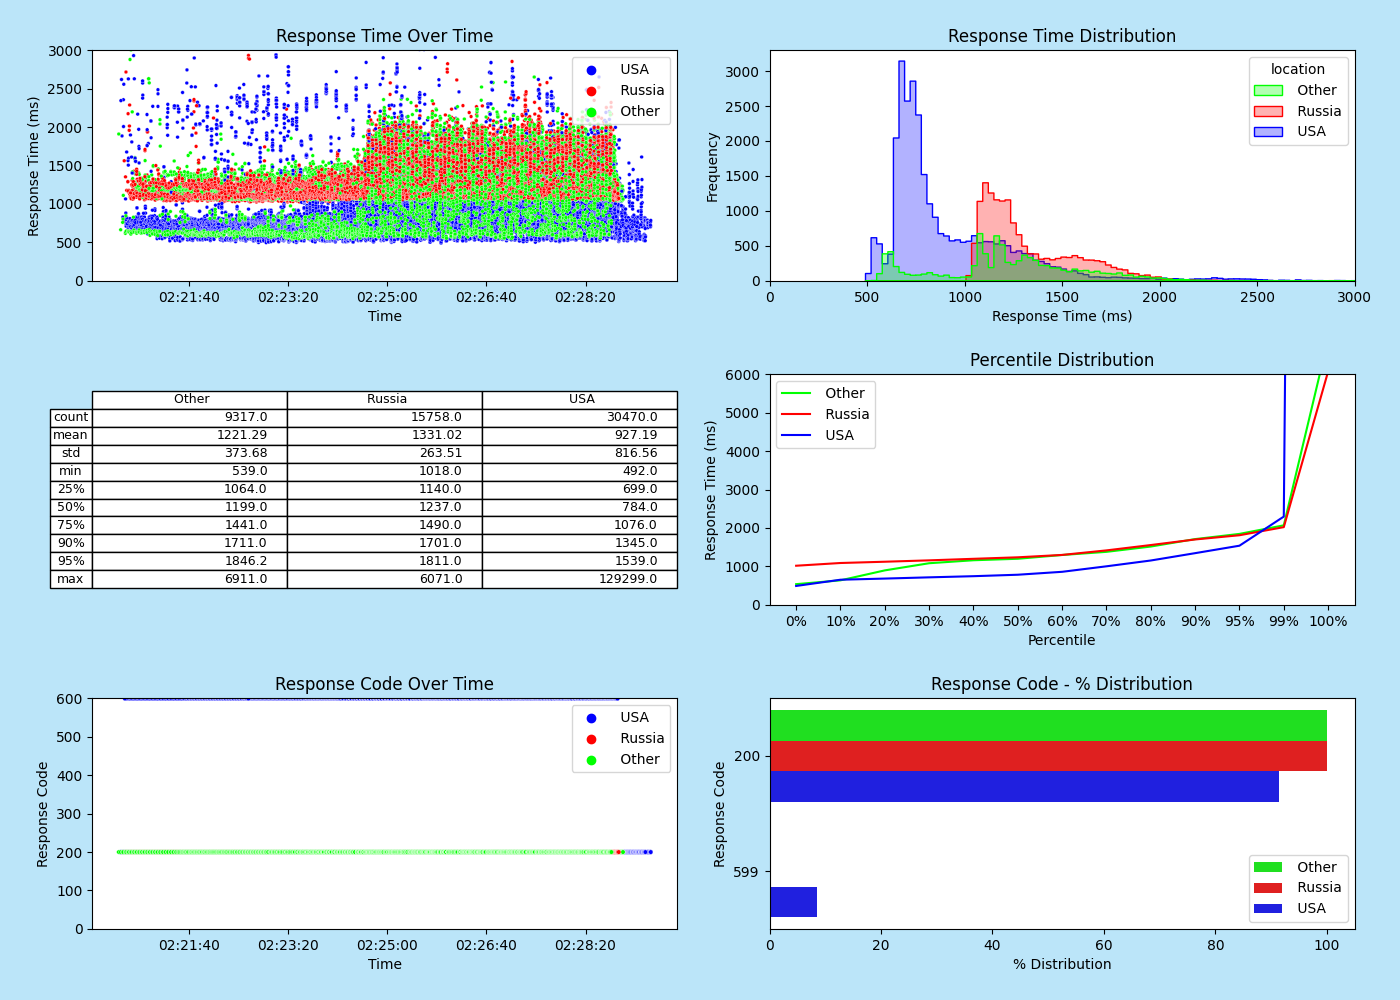
Our friend
Harinder Seera
has created these beautiful plots
histogram2.png
,
graphs2.png
, shown below. The code repository is
https://github.com/hseera/neocortix-jmeter-histogram.
Running Longer Tests With A Realistic Target
We also include Here is an example output
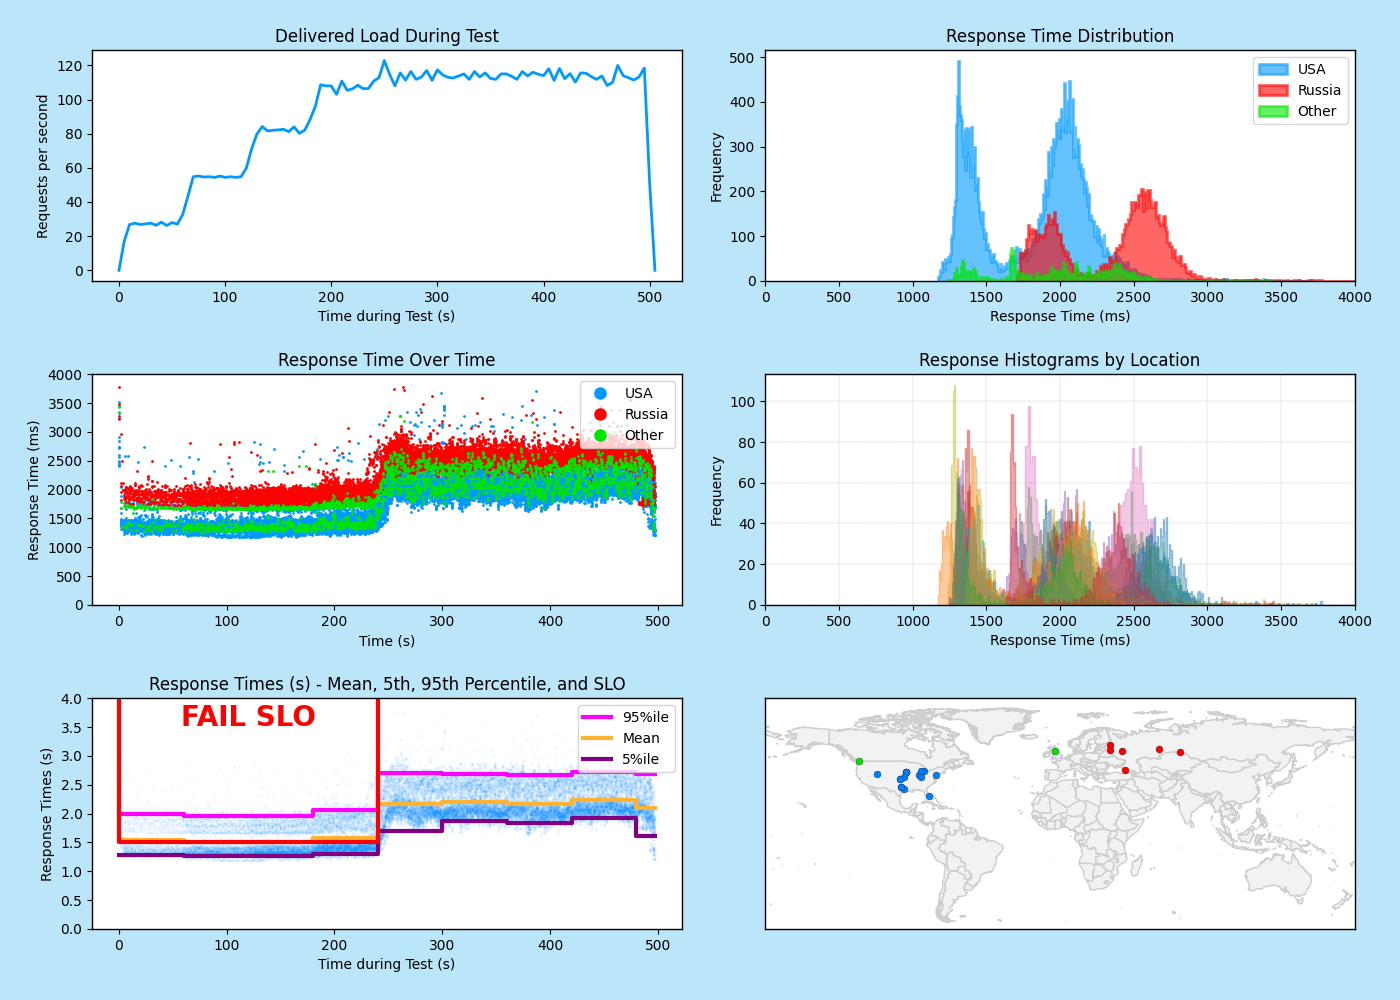
TestPlan_RampLong_MoreSlow.jmx
, which does a 500 second Load Test with 30 devices with a 5-step ramp at 60 seconds
for each step, hitting a load test target that takes about 1 second to respond and does some CPU-intensive work, representing an unoptimized server. Just edit runBatchJMeter.py
and substitute TestPlan_RampLong_MoreSlow.jmx
for
TestPlan.jmx
, and set endFrame = 30, nWorkers = 54
, and re-run
./runBatchJMeterAll.sh
graphs3.png
,
which shows that the server does not meet the Service Level Objective (SLO) that the 95th percentile of response times as seen by the end-user should be less than 1.5s for the first four 60-second steps of the ramp:
We also include Here is an example output
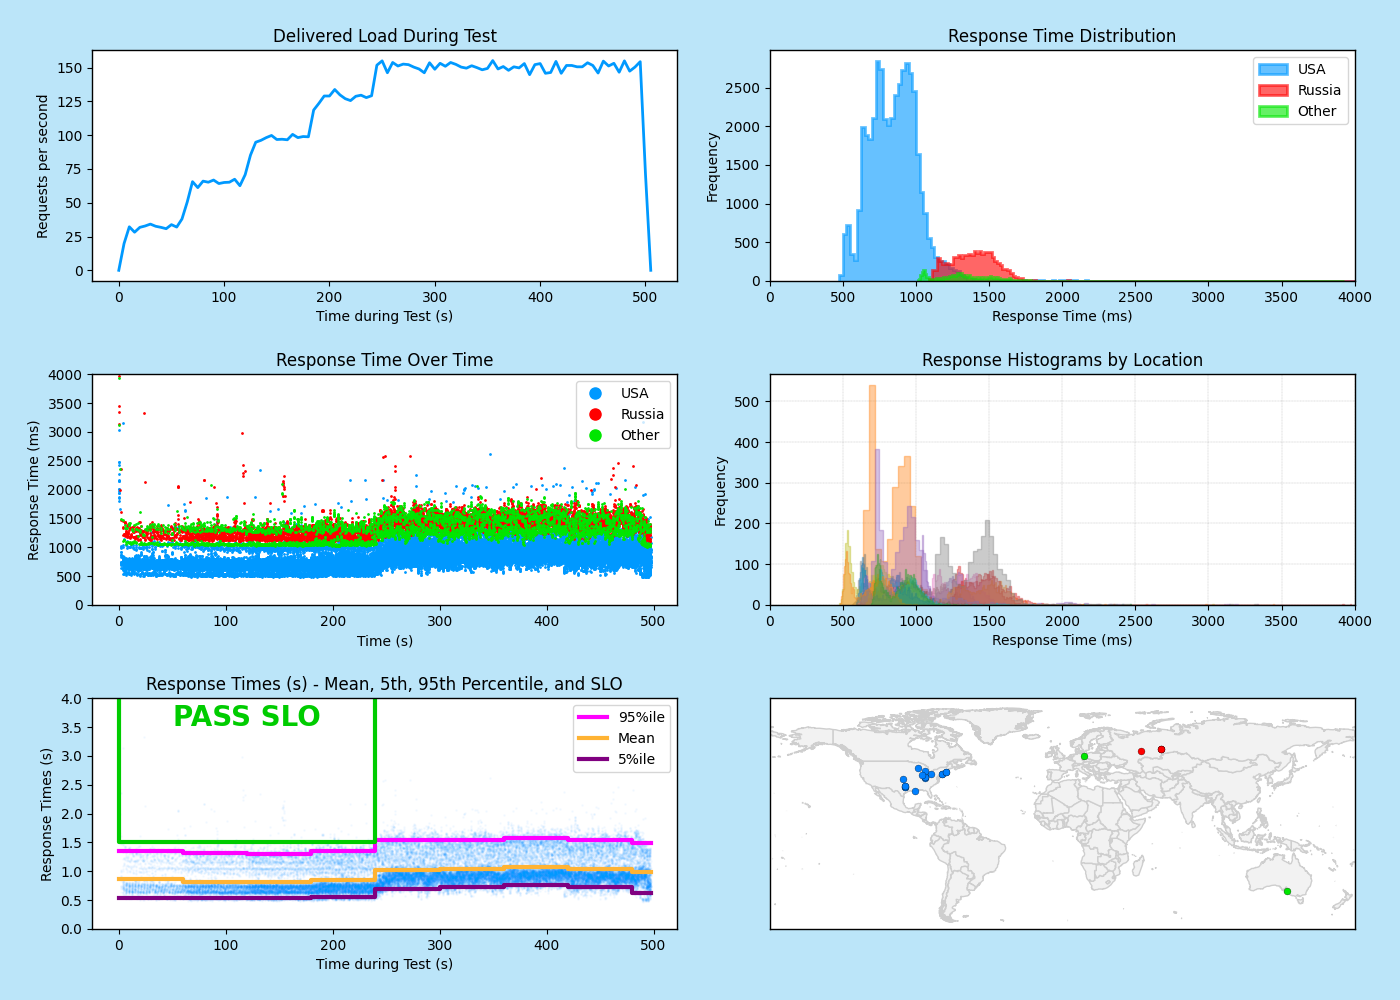
TestPlan_RampLong_LessSlow.jmx
, which does a 500 second Load Test with 30 devices with a 5-step ramp at 60 seconds
for each step, hitting a load test target that takes about 0.3 second to respond and does somewhat less CPU-intensive work, representing a better-optimized server. Just edit runBatchJMeter.py
and substitute TestPlan_RampLong_LessSlow.jmx
for
TestPlan.jmx
, and set endFrame = 30, nWorkers = 54
, and re-run
./runBatchJMeterAll.sh
graphs3.png
,
which shows that the server does meet the Service Level Objective (SLO) that the 95th percentile of response times as seen by the end-user should be less than 1.5s for the first four 60-second steps of the ramp:
Test Results Report
We also produce
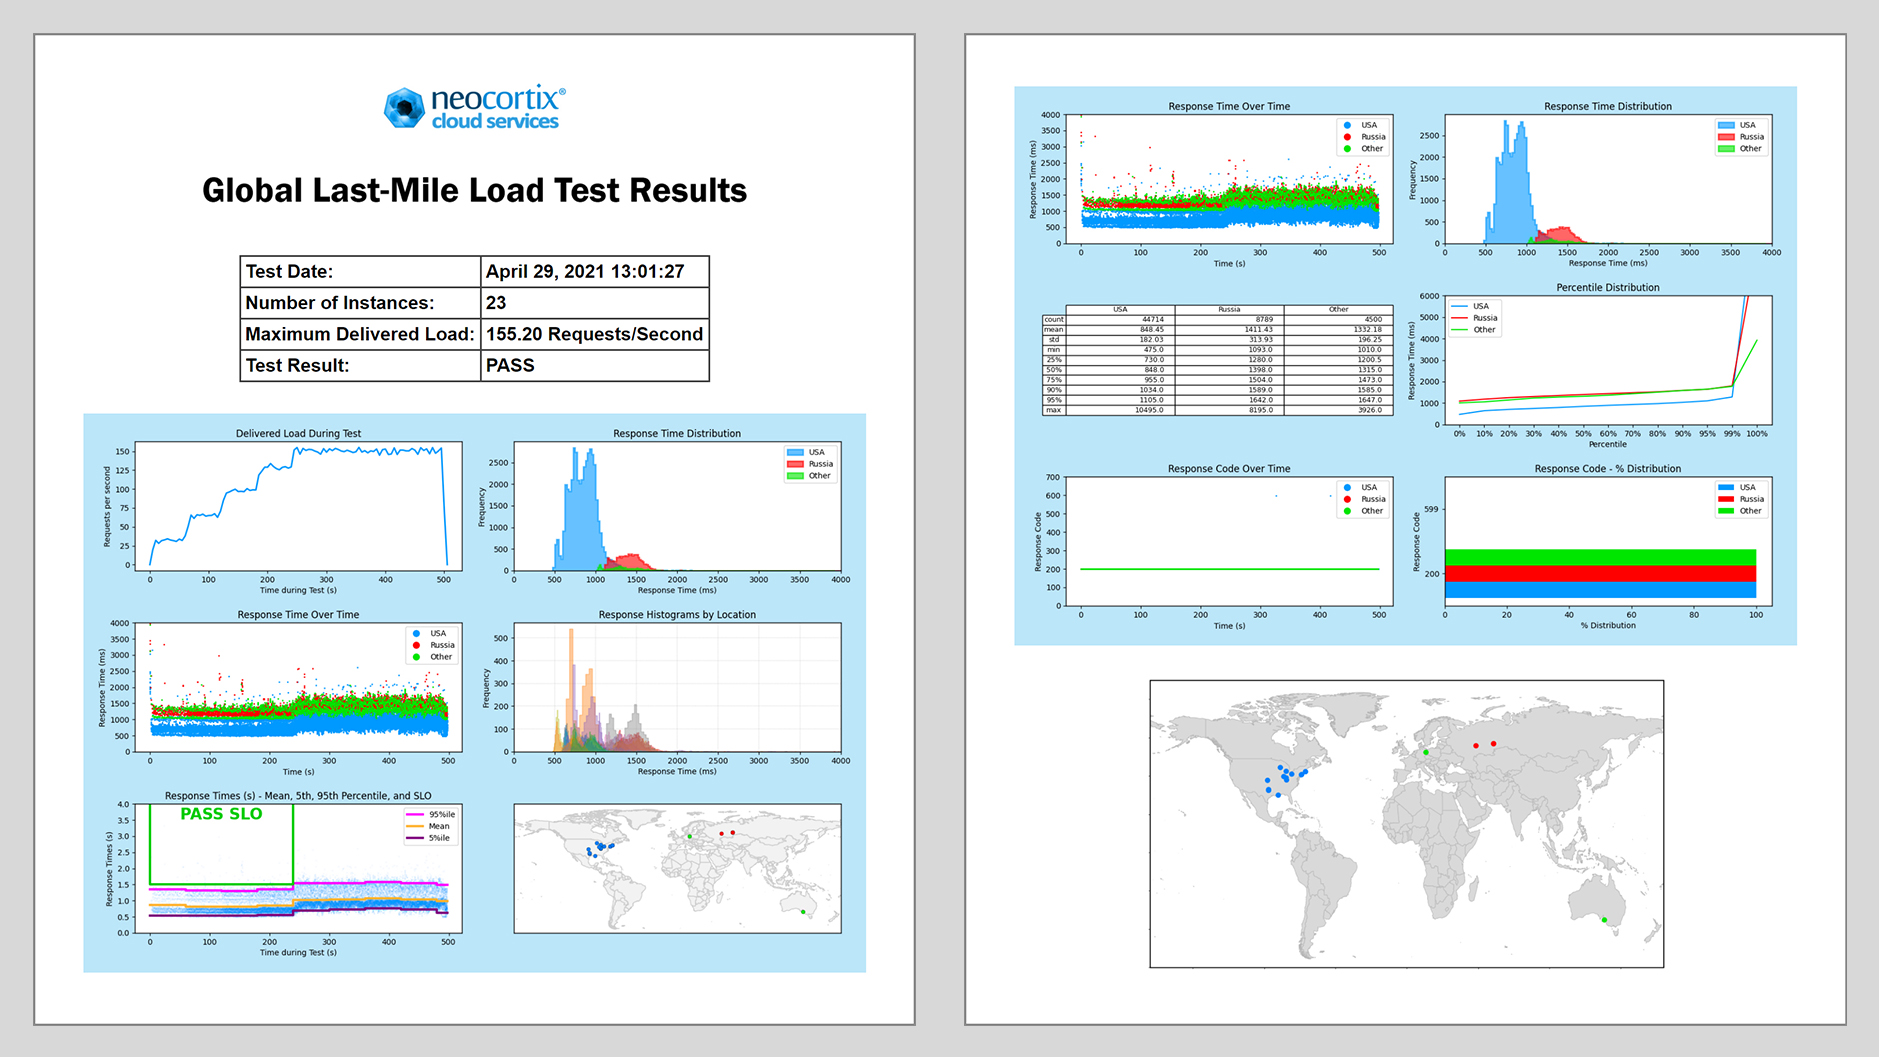
TestResults.html
, which provides a graphical summary of all of the results:
And finally, we produce
testResults.xml
, which can be used to return PASS/FAIL results to CI/CD Automation tools, such as CircleCI Orbs or Jenkins Plug-Ins.