
In this tutorial, we will show you how to use Neocortix Cloud Services Scalable Compute to run a distributed LoadTest batch job, using a Gatling
client, in a framework where you can easily substitute your own Gatling .scala script file.
At the end of the tutorial, we will show you how to stream data in real-time to an InfluxDB server.
First, please follow the steps in the tutorial Setting Up For Batch Jobs.
After completion of the initial setup, you will have a directory with examples,
~/ncsexamples
.
Prepare The Master for Interactive Performance Charts
To prepare the Master for interactive Performance charts, please execute these commands in the 
~/ncsexamples/batchMode
directory:
curl -L https://repo1.maven.org/maven2/io/gatling/highcharts/gatling-charts-highcharts-bundle/3.4.0/gatling-charts-highcharts-bundle-3.4.0-bundle.zip > gatling-3.4.0.zip
unzip -q gatling-3.4.0.zip
mv gatling-charts-highcharts-bundle-3.4.0 gatling-3.4.0
In the subdirectory
~/ncsexamples/batchMode
you will find the runBatchGatling.py command.
This script will create a set of instances running on mobile devices, one instance for each load generator.
In the default example provided, we ask for 6 successful instances:
startFrame = 1,
endFrame = 6,
nWorkers = 10,
By setting
nWorkers = 10
, we slightly over-allocate instances to allow for some fraction to fail.
It will command the
instances to install Gatling, and then run Gatling with a short (90 seconds) and simple test plan to send http
requests to the target URL (currently
https://loadtest-target.neocortix.com
):
def frameCmd( self, frameNum ):
# substitute your own gatling simulation class, and put the scala file in the gatlingWorker dir
# -or- modify the provided gatlingWorker/ncsSim.scala file to change details of the test
simulationClass = 'neocortix.ncsSim'
cmd = '~/gatling-charts-highcharts-bundle-3.4.0/bin/gatling.sh -nr --simulation %s -sf ~/gatlingWorker -rf ~/gatlingResults_%03d' % (
simulationClass, frameNum
)
return cmd
The output of each instance will be
a directory
gatlingResults_<n>
containing request response timing information for each worker. The master will create several
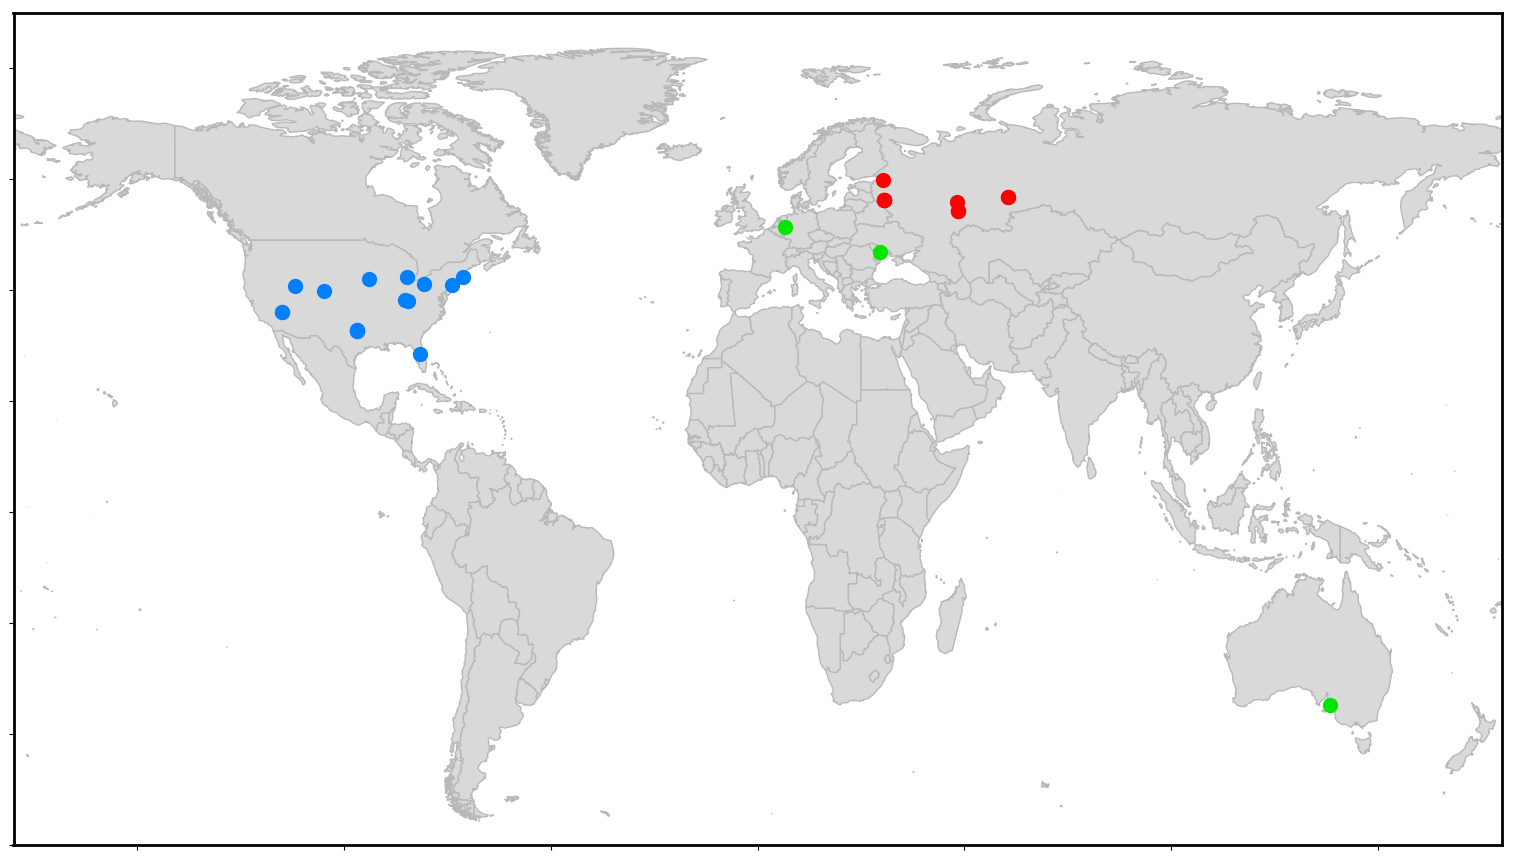
image files worldMap.png
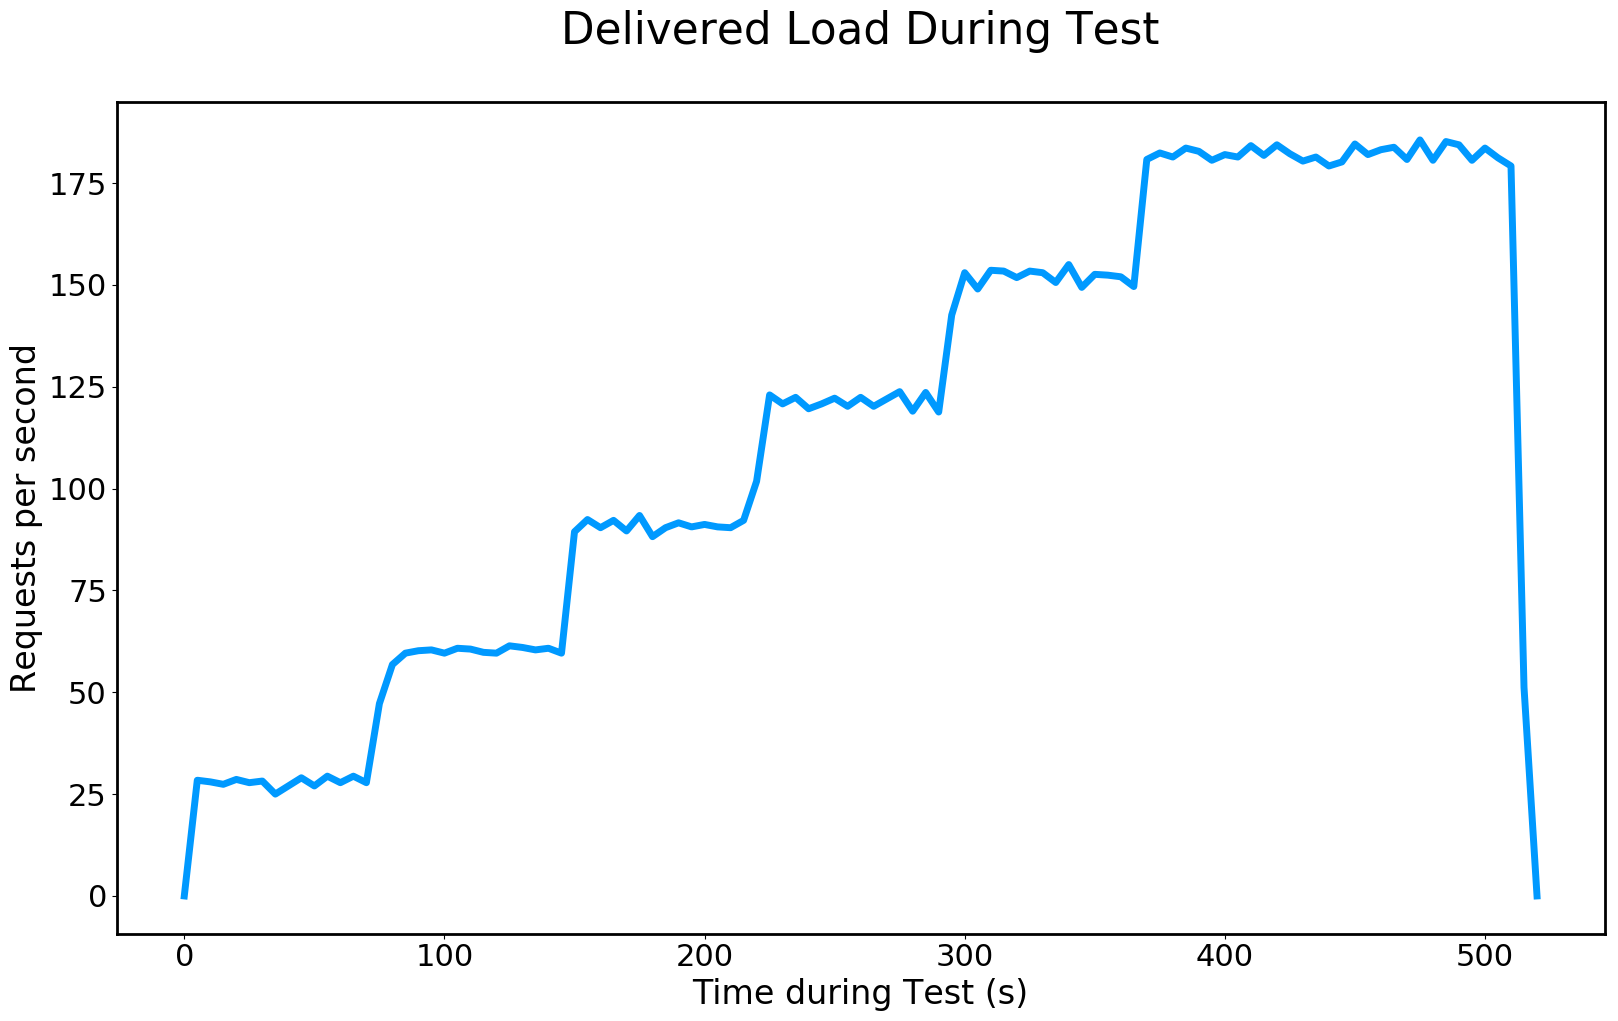
, deliveredLoad.png
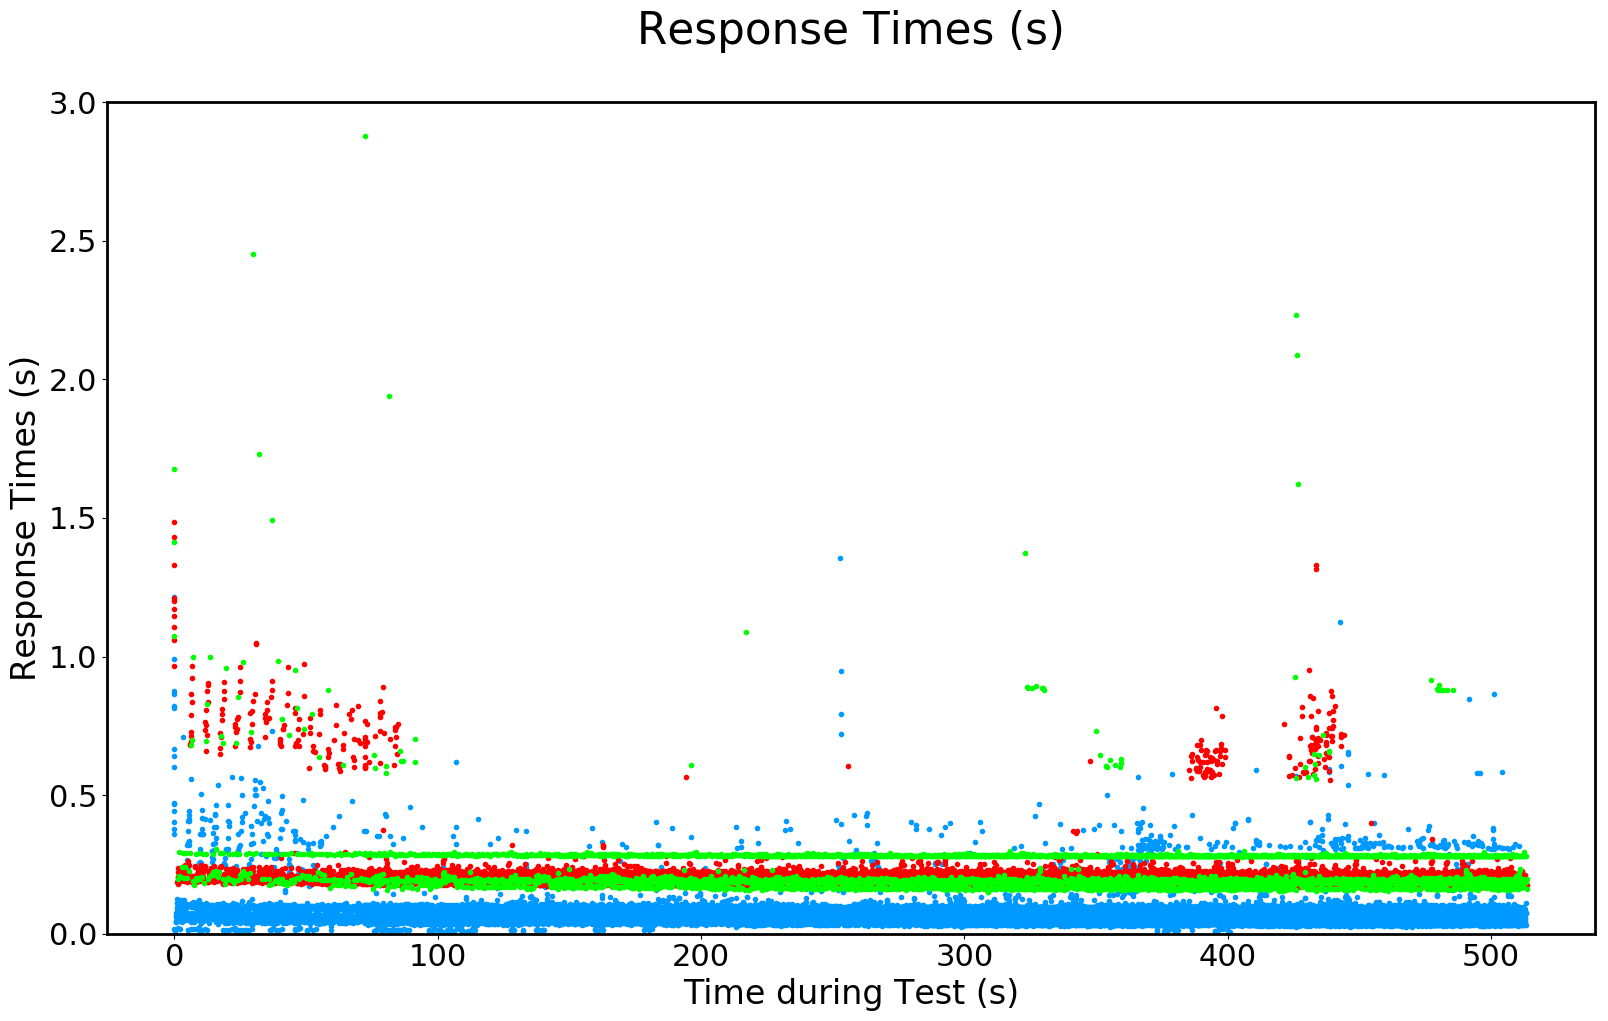
, responseTimesByRegion.png
,
and then terminate the instances.
Example Command
Simply run
When the program is done, the output files
python3 ./runBatchGatling.py
gatlingResults_<n>
, worldMap.png
,
deliveredLoad.png
, responseTimesByRegion.png
, will be put in a directory
./data/gatling_<datestamp>
Running a Longer Ramped Load Test
To run a longer ramped Gatling load test,
for 500 seconds with 30 devices,
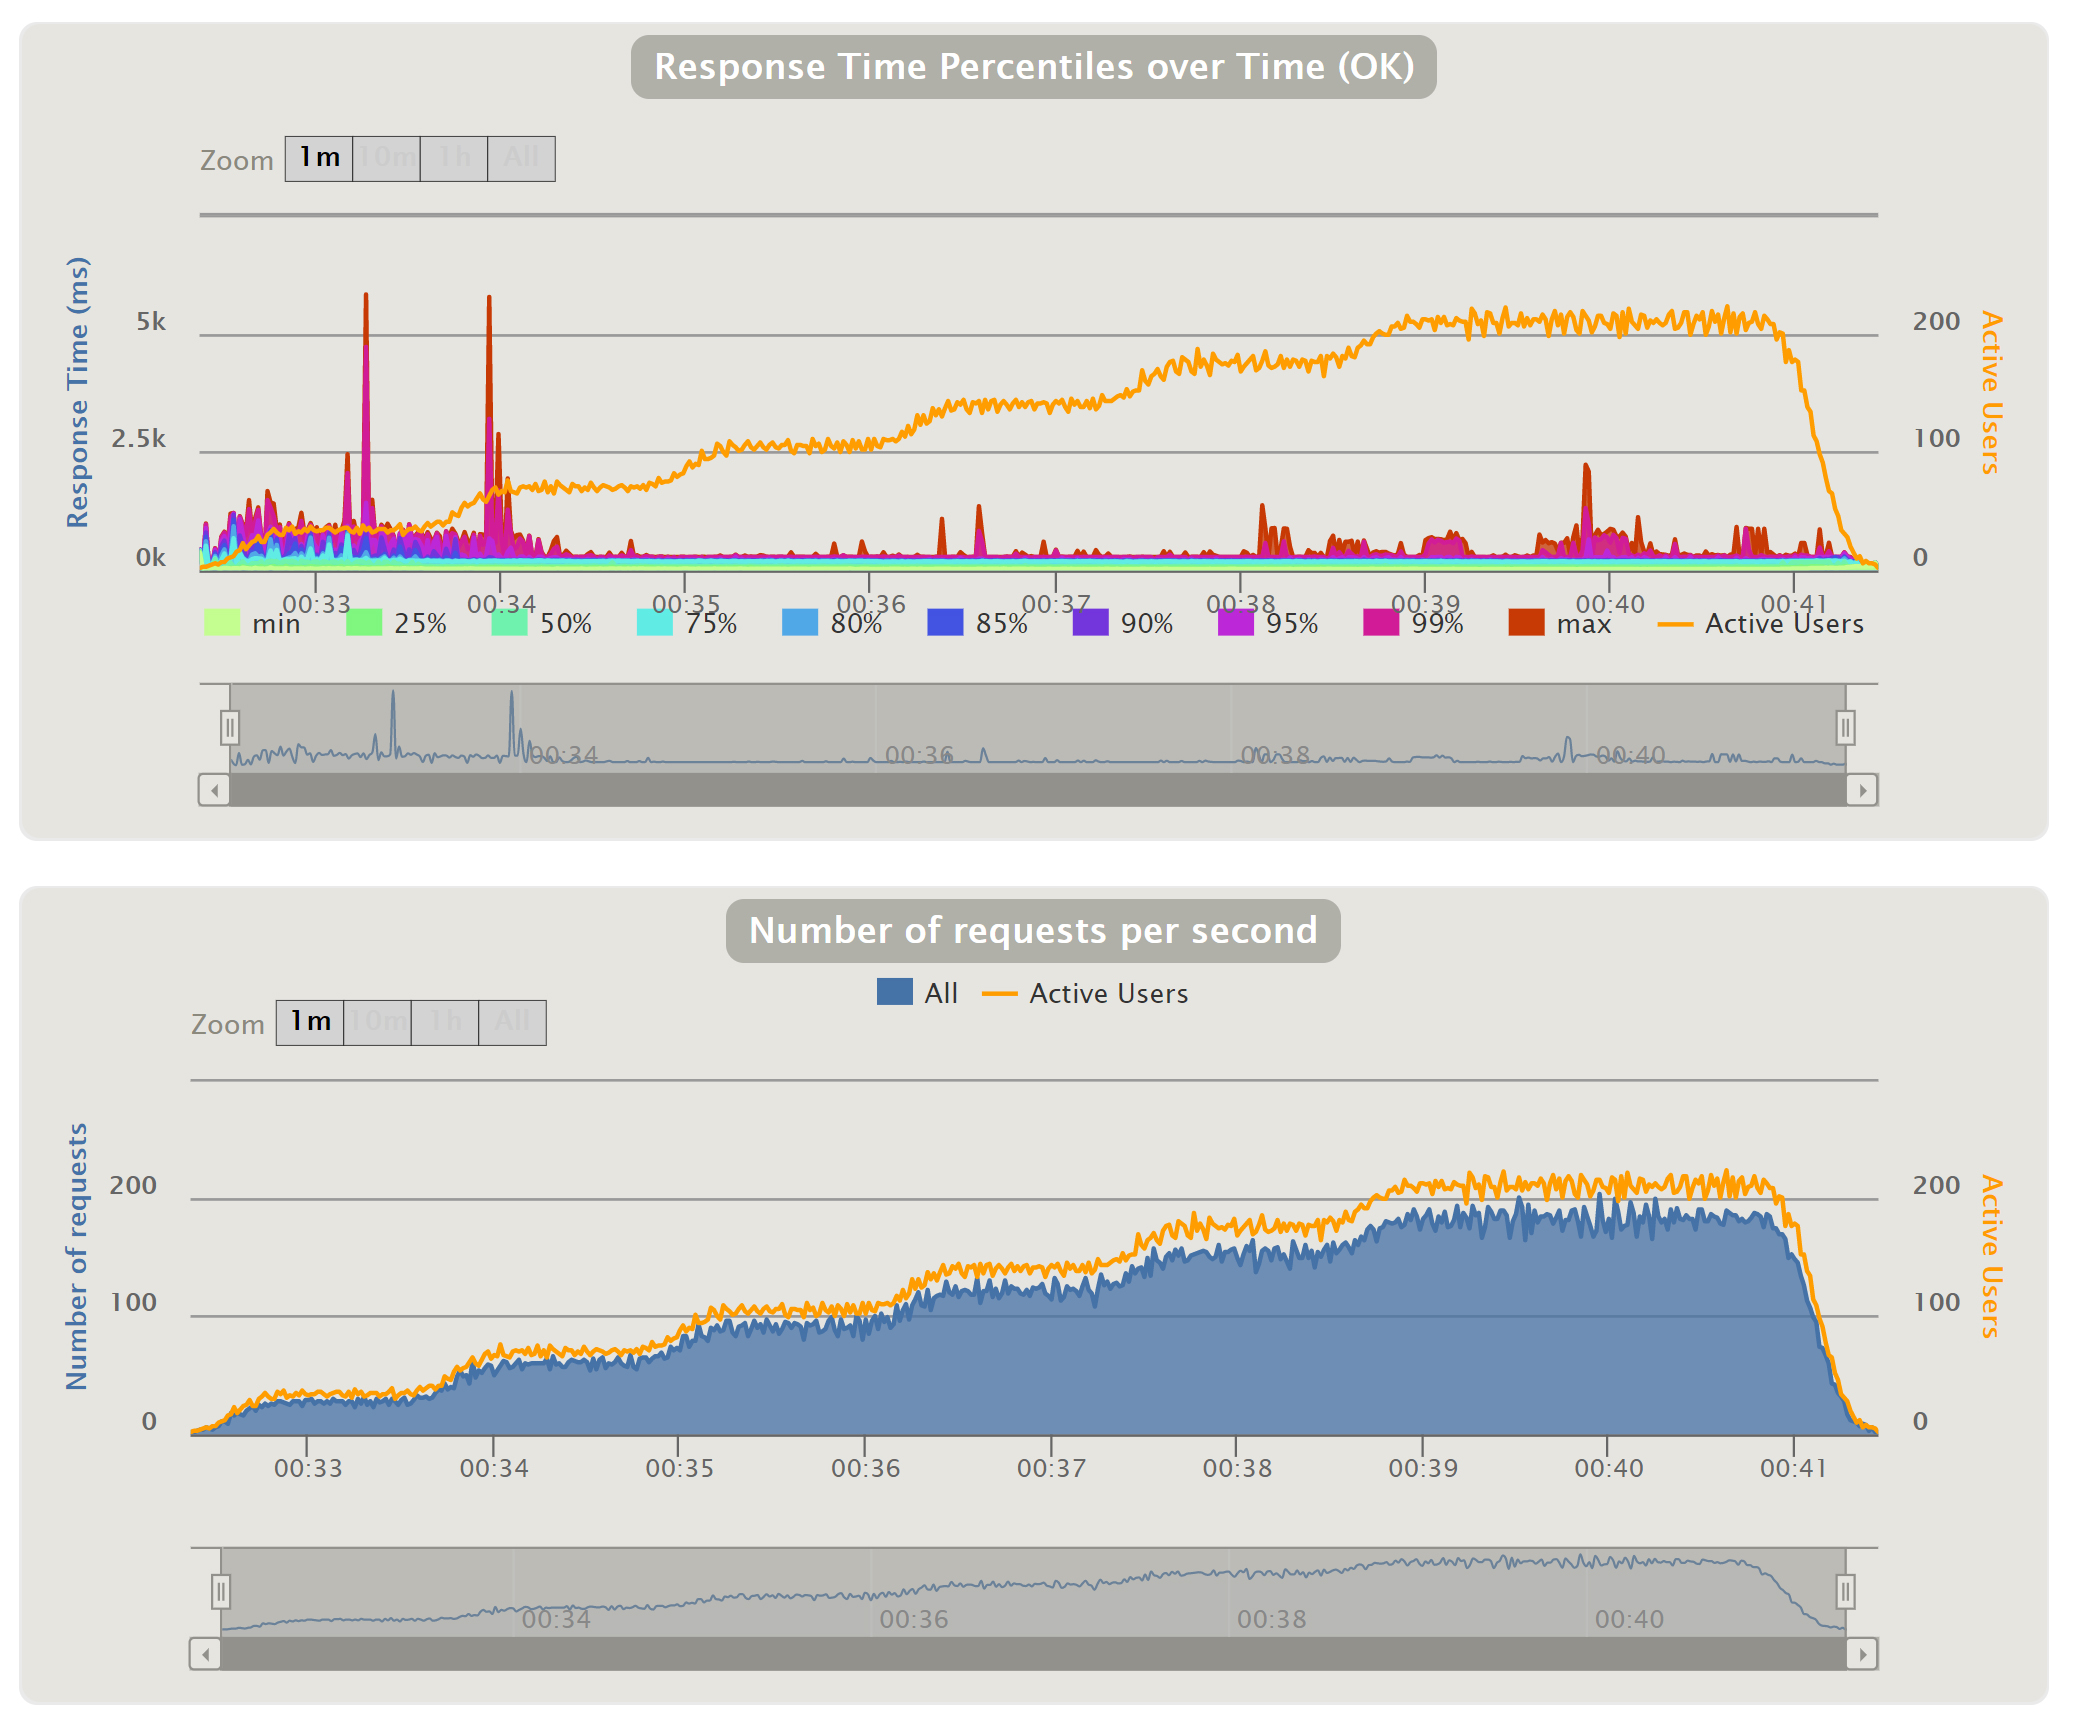
please edit Here are example outputs:
runBatchGatling.py
and
set timeLimit = 80*60, instTimeLimit = 14*60, frameTimeLimit = 14*60, endFrame = 30, nWorkers = 54
,
then please edit ./gatlingWorker/ncsSim.scala
and
uncomment the line scn.inject( rampConcurrentUsers(1) to (6) during (360 seconds), constantConcurrentUsers( 6 ) during (140 seconds ) )
then re-run
python3 ./runBatchGatling.py
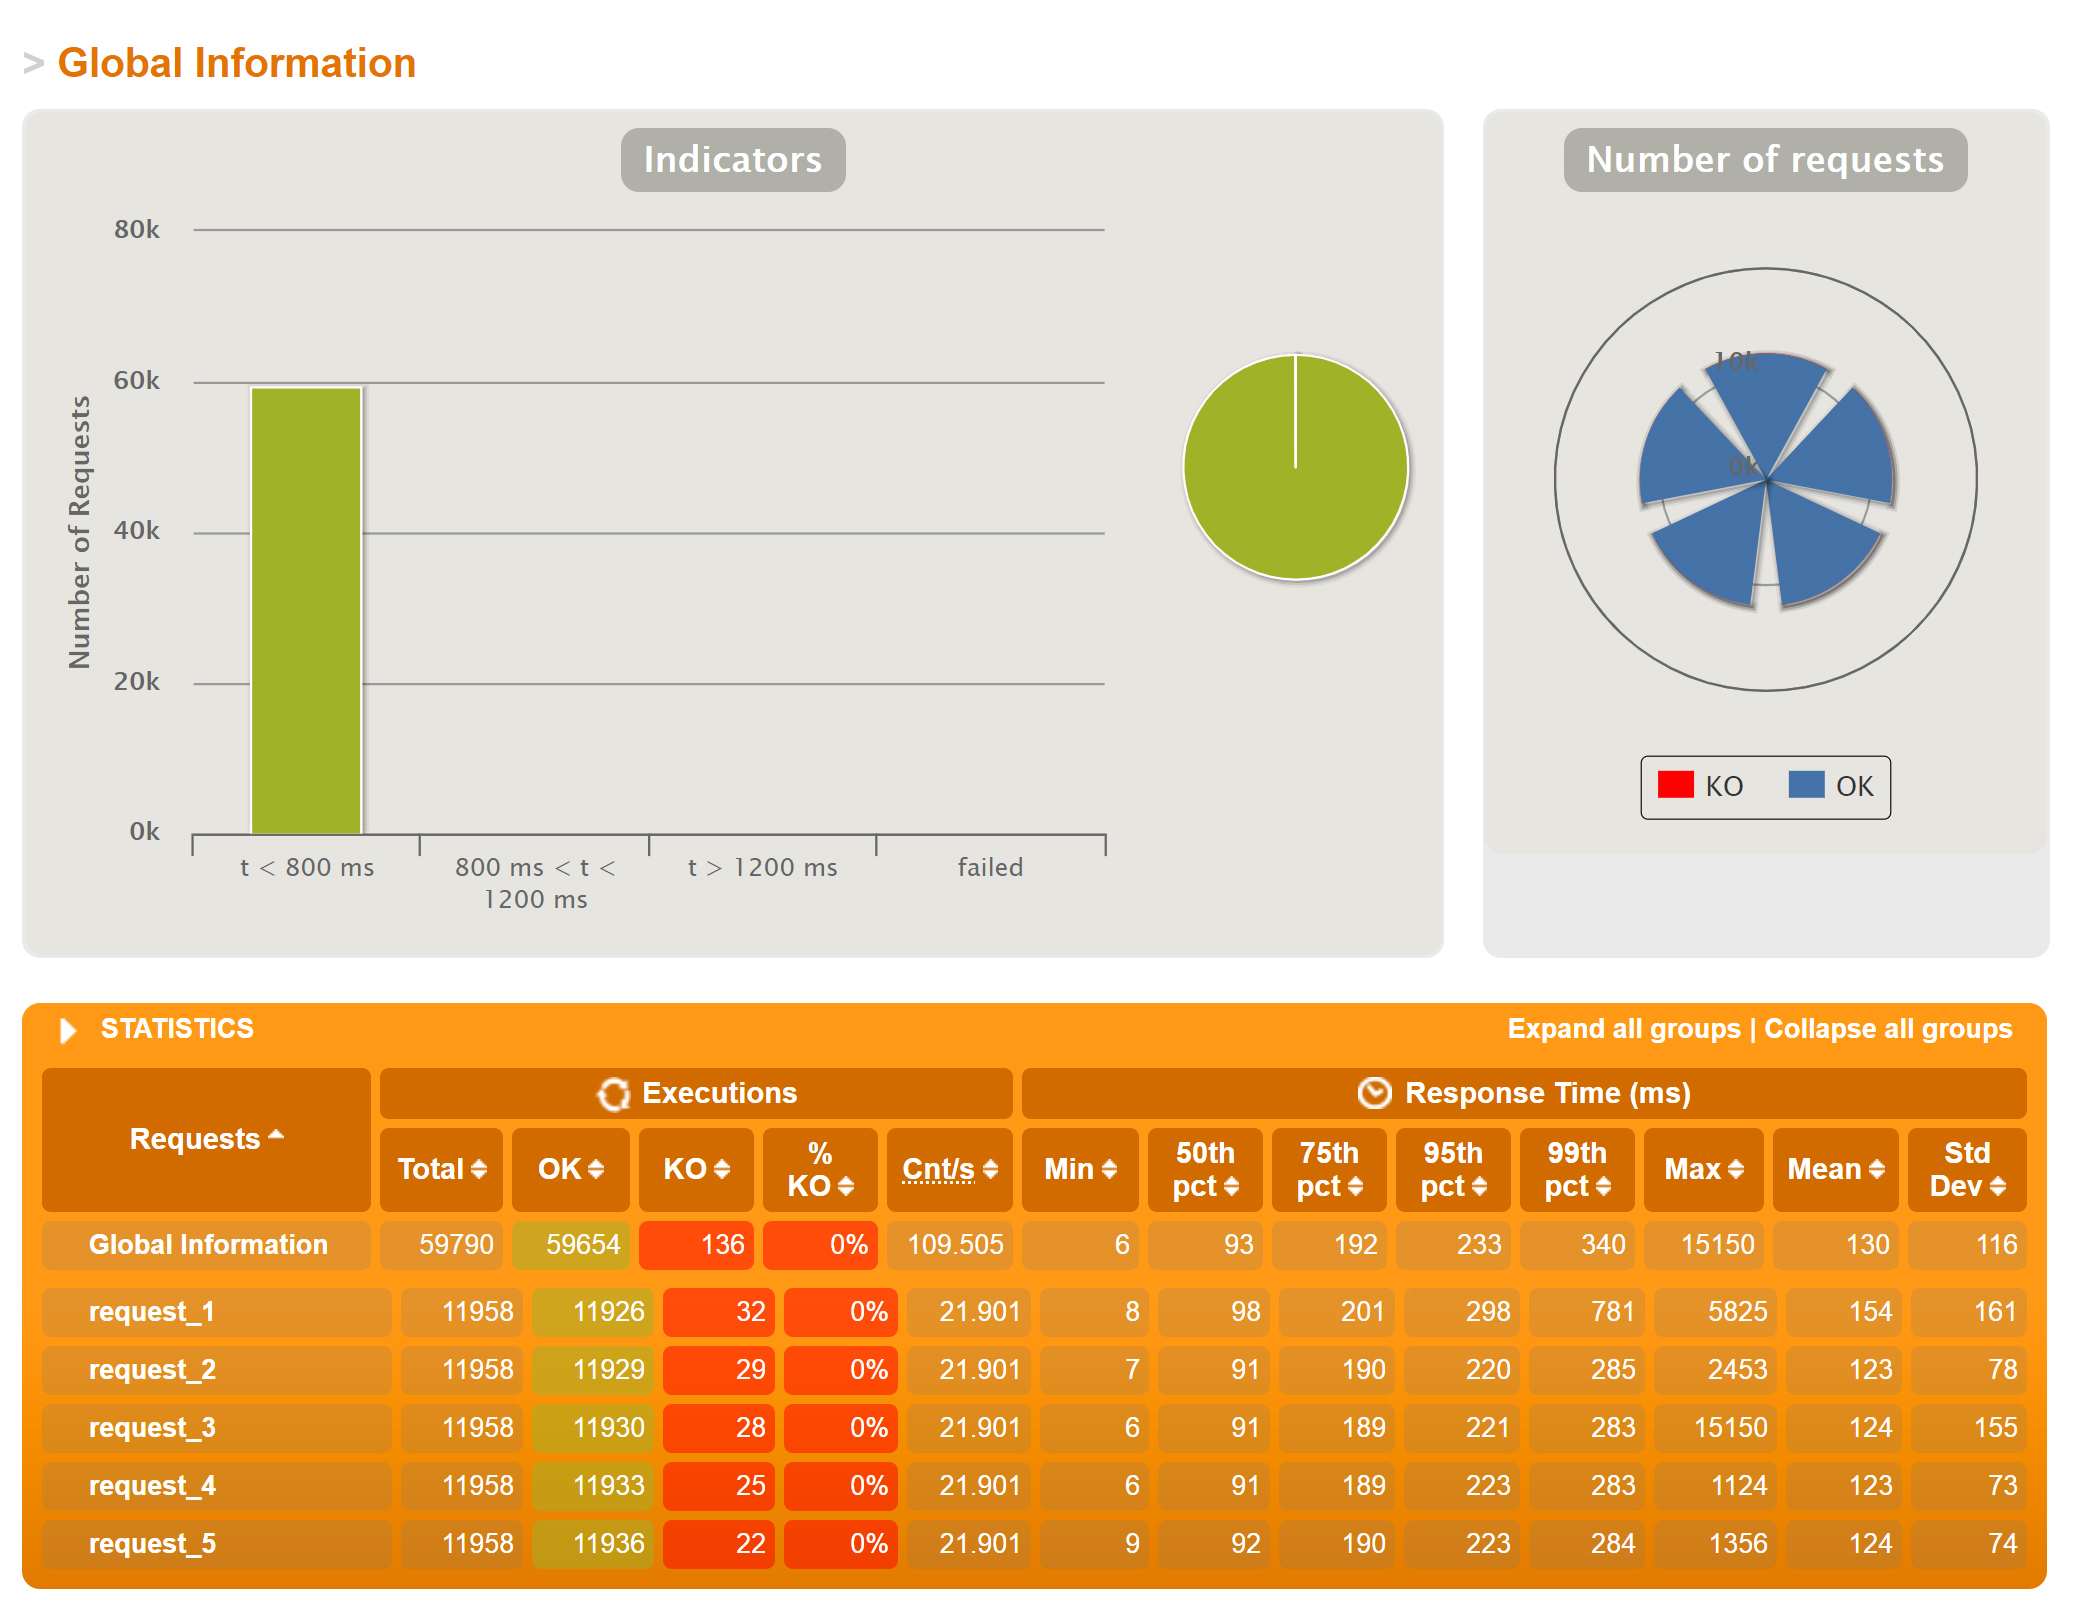
Viewing Interactive Performance Charts
If Gatling was installed on the Master, as described above, interactive performance graphs will be placed in
On a desktop or laptop computer with a browser, you should be able to view those interactive graphs in Chrome or Firefox.
./data/gatling_<datestamp>/gatlingResults_aggregated/index.html
Here are example outputs:
Substituting Your Own .scala Script
Here we will show you how to use your own Gatling .scala script
First, place a copy of
yourScript.scala
, which contains the following package specifier
yourPackageName
and class specifier
yourClassName
:
package yourPackageName
class yourClassName extends Simulation {
...
}
yourScript.scala
into the
./gatlingWorker
directory.
Then, please edit then re-run
./runBatchGatling.py
and
set simulationClass = 'yourPackageName.yourClassName'
python3 ./runBatchGatling.py
Sending Data to an InfluxDB Server
If you have a running Influxdb server, or access to a hosted Influxdb service, you can configure your Gatling workers to send data to it in real time. To do this, you can edit the
gatling.conf
file in the
./gatlingWorker
directory.
Official instructions for that can be found at
https://gatling.io/docs/current/realtime_monitoring/.
https://gatling.io/docs/current/realtime_monitoring/.
Typically, you need to change the line
To
Also, change one or more lines of the graphite section to something like the following example, where we changed only the “host” line.
(The lines beginning with # are commented out.)
#writers = [console, file]
writers = [console, file, graphite]
graphite {
#light = false # only send the all* stats
host = "YourDatabaseServer.YourDomain.com"
#port = 2003 # The port to which the Carbon server listens to (2003 is default for plaintext, 2004 is default for pickle)
#protocol = "tcp" # The protocol used to send data to Carbon (currently supported : "tcp", "udp")
#rootPathPrefix = "gatling" # The common prefix of all metrics sent to Graphite
#bufferSize = 8192 # Internal data buffer size, in bytes
#writePeriod = 1 # Write period, in seconds
}
To configure your Influxdb server to support Gatling, you need to enable “graphite” support in your influxdb.conf file. (Graphite is a protocol that Gatling uses to communicate with Influxdb or other data recorders.) Official details on that are available at
https://docs.influxdata.com/influxdb/v1.8/supported_protocols/graphite/.
https://docs.influxdata.com/influxdb/v1.8/supported_protocols/graphite/.
A typical graphite section of influxdb.conf would look like
For better security, change the port number in both places to something other than 2003. There is unfortunately no authentication in the graphite protocol, but using a non-default port number will reduce the likelihood of some types of attacks.
[[graphite]]
enabled = true
database = "gatlingdb"
#bind-address = ":2003"
templates = [
"gatling.*.*.*.* measurement.simulation.request.status.field",
"gatling.*.users.*.* measurement.simulation.measurement.request.field"
]