In this tutorial, we will show you how to use Neocortix Cloud Services Scalable Compute to run a distributed LoadTest batch job, using a JMeter
client, while monitoring the server with Dynatrace.
First, you need to sign up for a Dynatrace account. You can start with a free 15-day trial at
https://www.dynatrace.com/trial/.
Next, please follow the steps in the tutorial Setting Up For Batch Jobs.
After completion of the initial setup, you will have a directory with examples,
~/ncsexamples
.
In the subdirectory 
~/ncsexamples/batchMode
you will find the runBatchDynatrace.py command.
This script creates a set of instances running on mobile devices, one instance for each load generator.
In the default example provided, we ask for 6 successful instances:
startFrame = 1,
endFrame = 6,
nWorkers = 10,
By setting
nWorkers = 10
, we slightly over-allocate instances to allow for some fraction to fail.
It will command the instances to install JMeter, and then run JMeter with a short (90 seconds) and simple
TestPlan_dynatrace.jmx
to send http
requests to the target URL (currently
https://loadtest-target.neocortix.com
):
def frameCmd( self, frameNum ):
cmd = 'date && apache-jmeter-5.3/bin/jmeter -n -t %s -l TestPlan_results_%03d.csv -D httpclient4.time_to_live=20000 -D httpclient.reset_state_on_thread_group_iteration=true' % (
self.JMeterFilePath, frameNum
)
cmd += ' && cp -p jmeter.log jmeter_%03d.log' % frameNum
return cmd
The output of each instance will be
a .csv file
TestPlan_result_<n>.csv
containing request response timing information for each worker. The master will create several
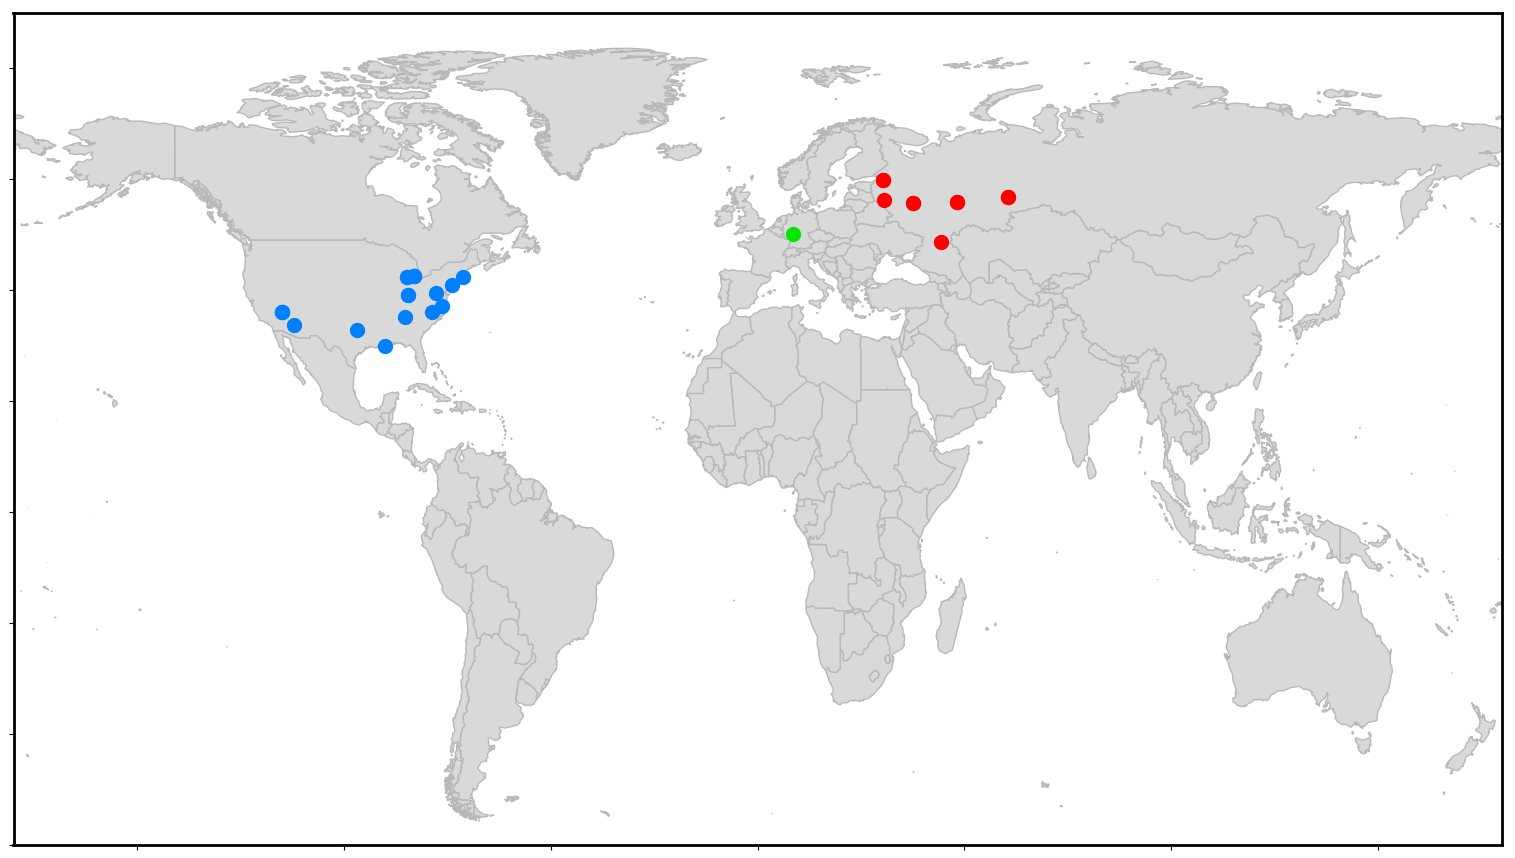
image files WorldMap.png
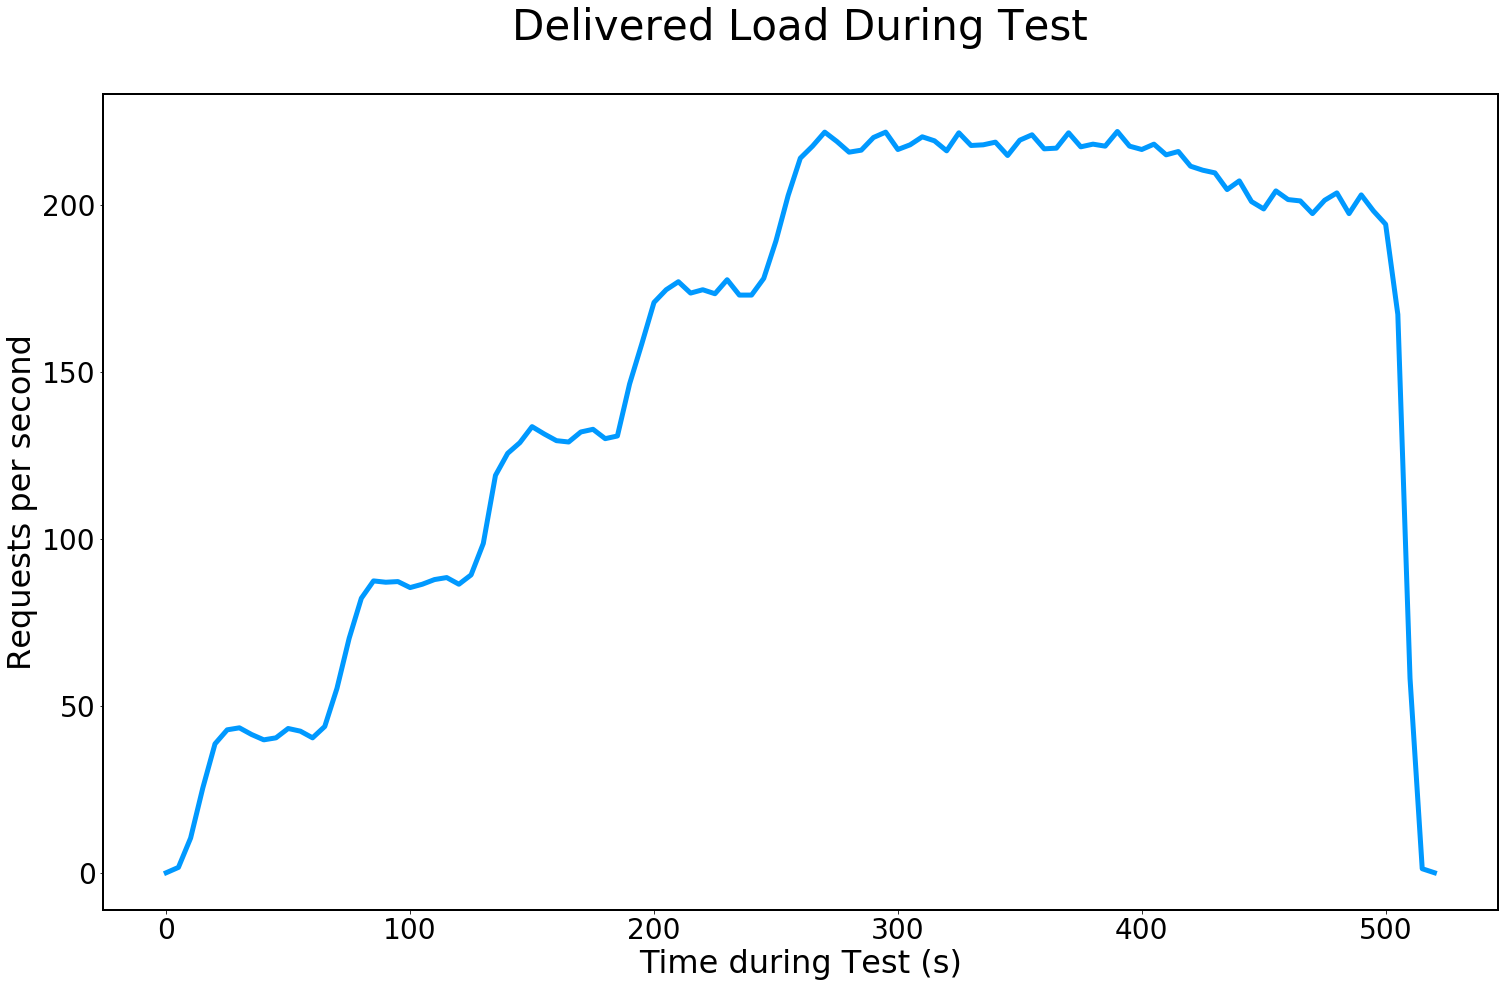
, DeliveredLoad.png
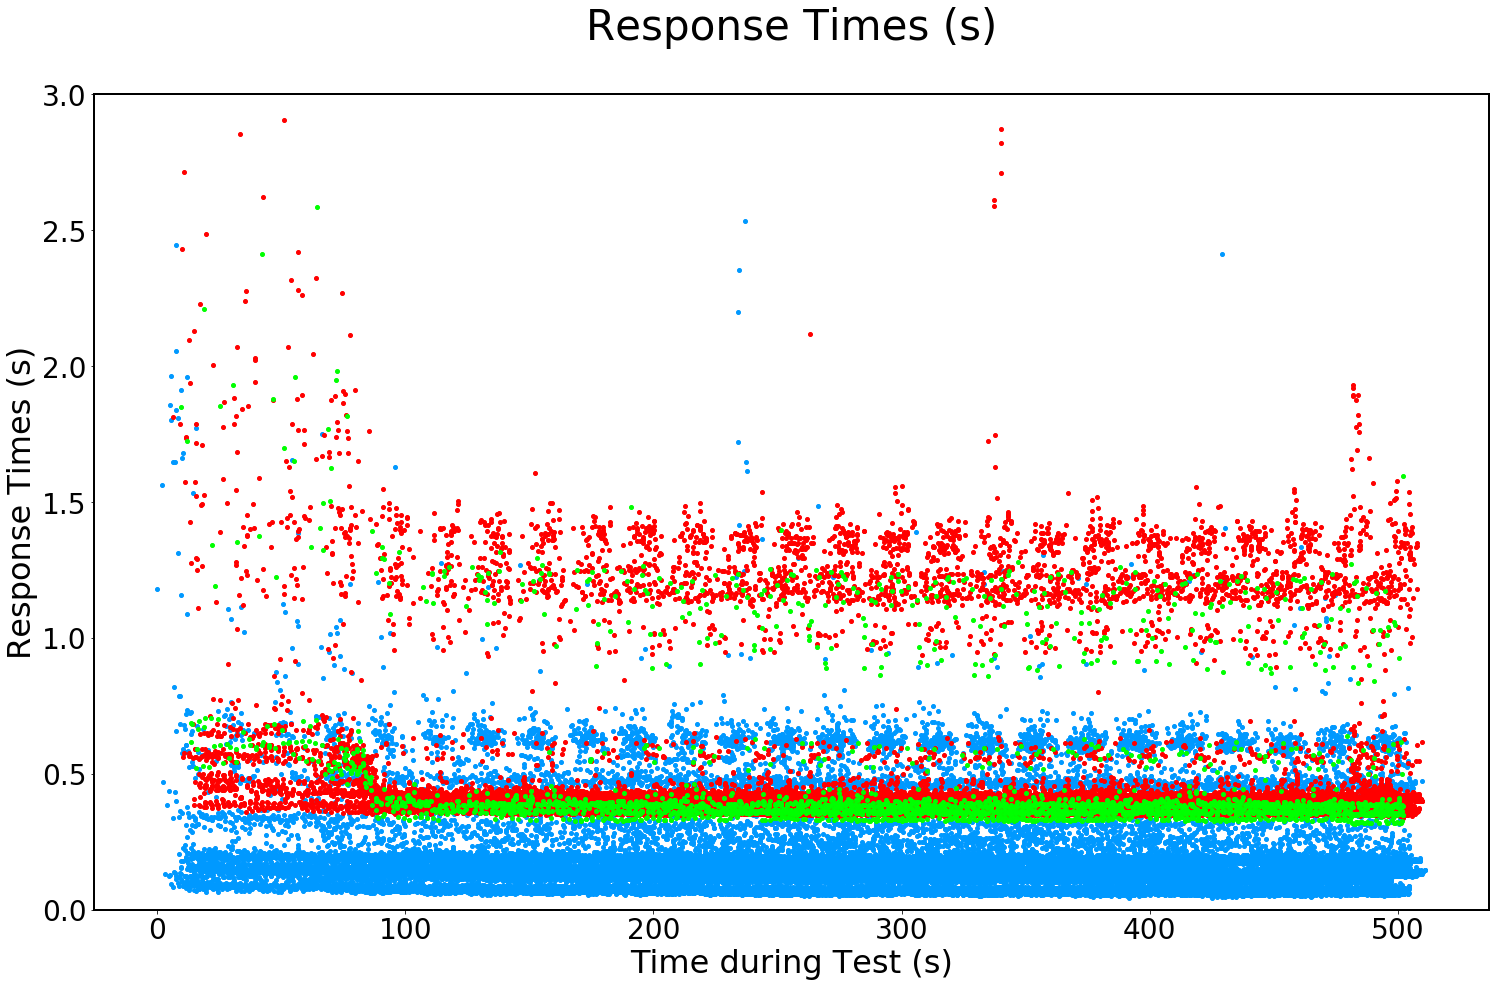
, ResponseTimesByRegion.png
,
and then terminate the instances.
Now you will configure
TestPlan_dynatrace.jmx
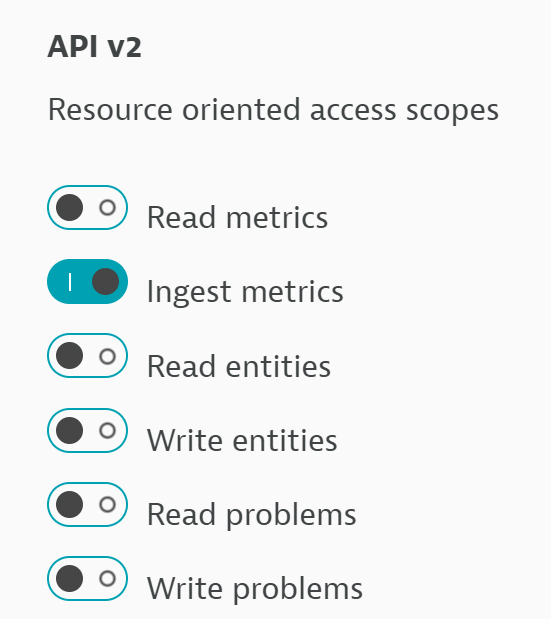
. After signing up for Dynatrace, you need to create an API access token by clicking on Left-Menu / Settings / Integration / Dynatrace API / Generate Token. Select the API v2 Ingest Metrics feature as shown:
TestPlan_dynatrace.jmx
file
in place of the "YourApiToken" placeholder. This field is called "dynatraceApiToken".
Next you need to set the "dynatraceMetricIngestUrl" field. When you signed up for dynatrace, they gave you a "monitoring instance" with a URL something like
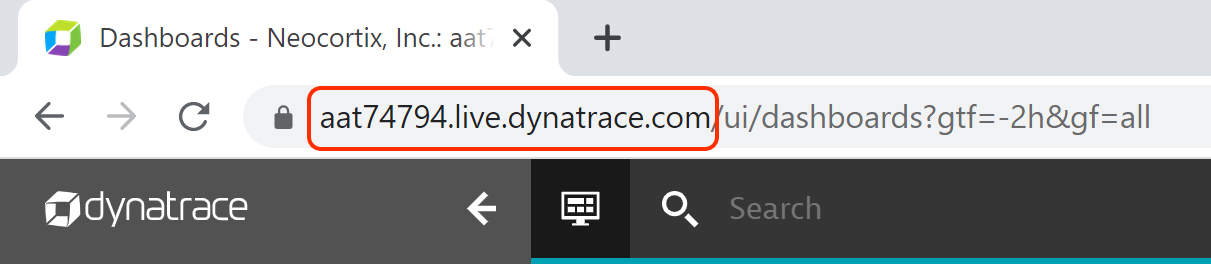
https://abc99999.live.dynatrace.com/
. You will find it in the browser address bar:
In the
TestPlan_dynatrace.jmx
file, find where it says https://xxxxx.live.dynatrace.com/api/v2/metrics/ingest
and replace the host part with the host part of your monitoring instance URL.
To test your own server, replace all occurrences of
loadtest-target.neocortix.com
with the URL of the web page you want to test (omitting the "https://" prefix).
Example Command
Simply run
When the program is done, the output files
python3 ./runBatchDynatrace.py
TestPlan_results_<n>.csv
, WorldMap.png
,
DeliveredLoad.png
, ResponseTimesByRegion.png
, will be put in a directory
./data/dynatrace_<datestamp>
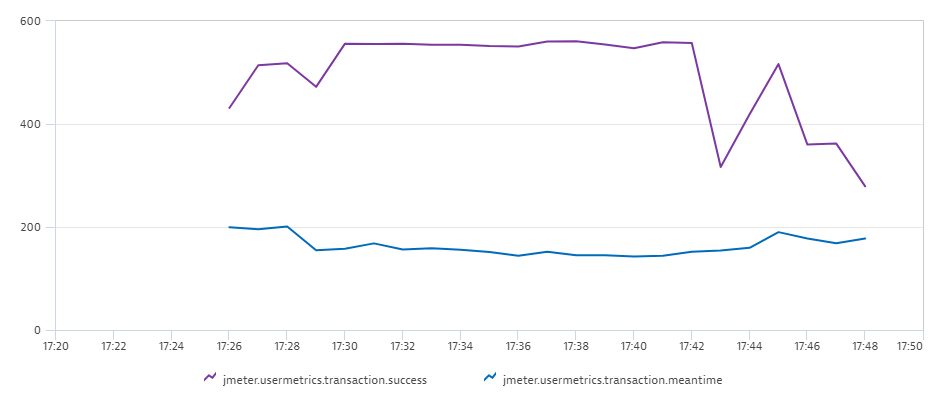
To see the metrics captured by Dynatrace,
- browse to your monitoring url
- create a dashboard (or use an existing dashboard)
- add a custom chart
- click on "try it out" in the banner at the top that says "Analyze multidimensional metrics from Prometheus, StatsD and others"
- in the "Filter metrics by..." text box, enter "jmeter.usermetrics.transaction.success" (without quotes)
- click "Add Metric"
- in the second "Filter metrics by..." text box, enter "jmeter.usermetrics.transaction.meantime" (without quotes)
- press enter
- click "run query"
- save the dashboard (so you won’t have to do these steps again)
- You may want to click "run query" a number of times to refresh the displayed graph as data becomes available from the loadtest workers.
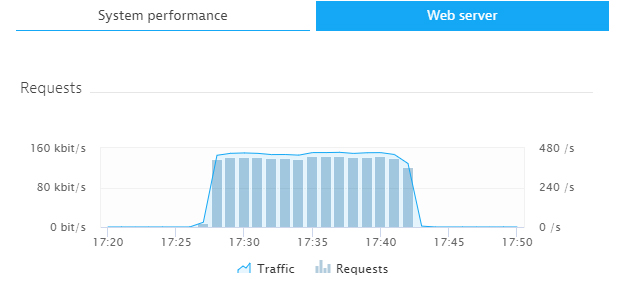
Running a Longer Ramped Load Test
We also include and follow the instructions above to edit
TestPlan_dynatrace_RampLong.jmx
, which does a 500 second Load Test with 30 devices with a 5-step ramp at 60 seconds
for each step. Just edit runBatchDynatrace.py
and substitute TestPlan_dynatrace_RampLong.jmx
for
TestPlan_dynatrace.jmx
, and set
endFrame = 30
nWorkers = 54
TestPlan_dynatrace_RampLong.jmx
with your Dynatrace API Token and Monitoring URL.
Then re-run
python3 ./runBatchDynatrace.py
Example Outputs