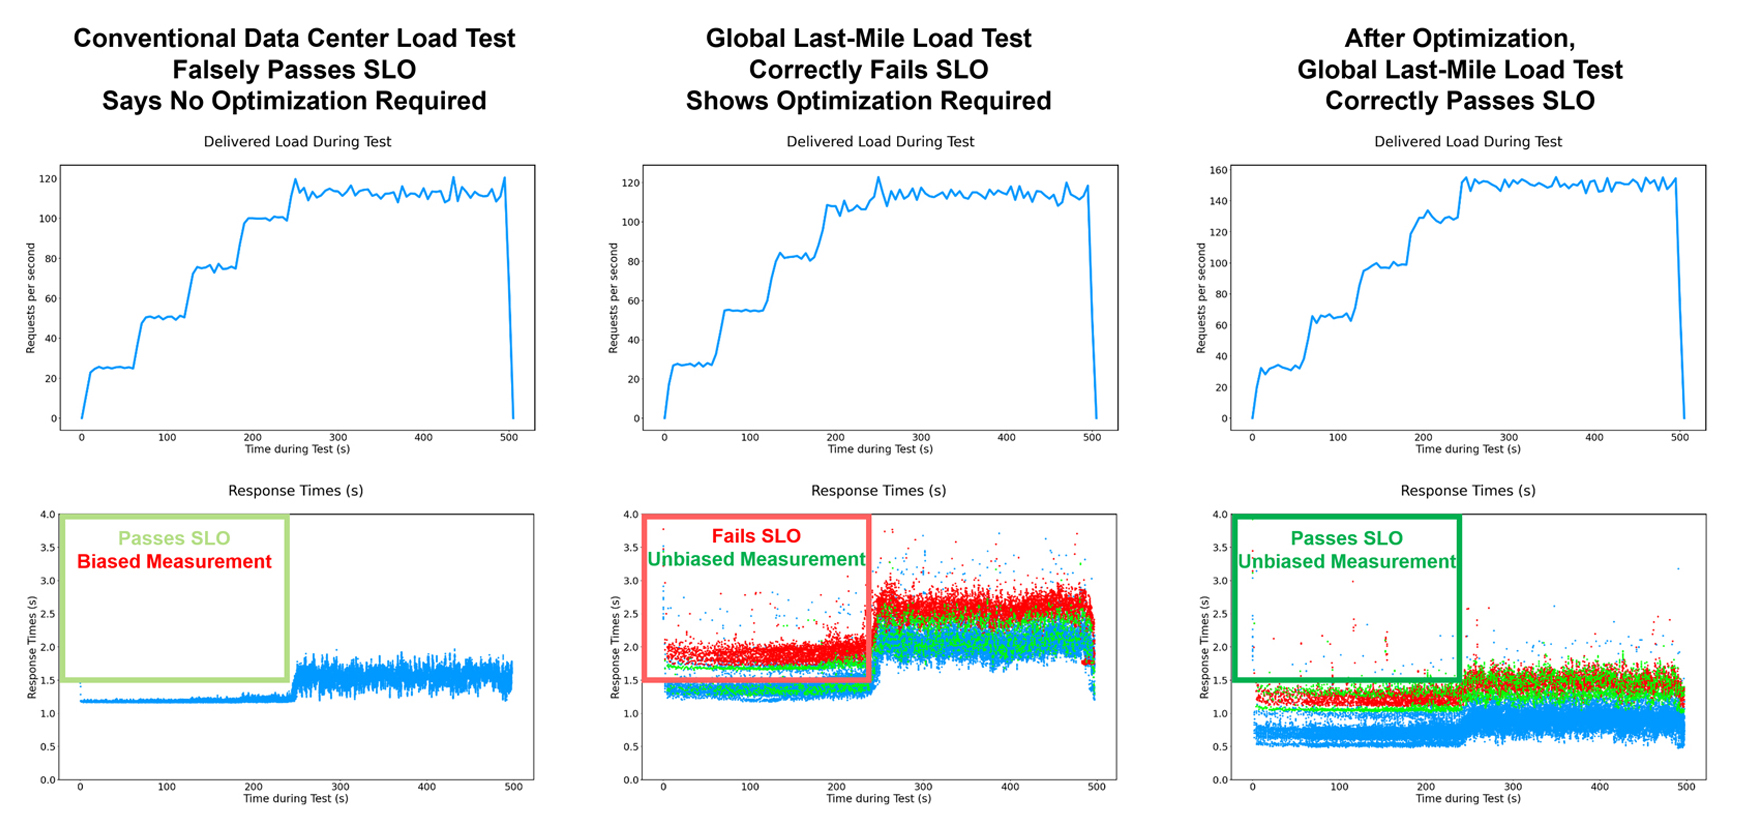
Here is a Performance Engineering case study. The Performance Engineer, Dave, runs a daily load test on his company's website hosted in Phoenix, with load generators in the nearest AWS data center in Oregon. The Service Level Objective requires that up to a load of 100 requests/second, the 95th percentile response time should be less than 1.5 seconds. Past optimizations have improved the website performance to the point where the SLO is just barely met, as shown in the Left panel of the figure.
This test is beautifully repeatable. Day In, Day Out, it passes. The Developers know of several optimizations to the website back-end code that would improve the performance, but they would be time-consuming and inconvenient (lots of nasty refactoring of code written by someone who left the team 6 months ago), and there is no management support to do them.
Every morning, Dave runs his Load Test, it passes, he happily files his report and gets lunch. Dave says, "Everything looks great over here!"
Unfortunately, customers are complaining to the support line, saying, "HELP! This Website is too slow!"
How can this be? Dave's tests are passing and meeting the requirements. Where is the disconnect?
Dave asks the Customer Support line for a breakdown of the locations of the complaining customers. They are coming from everywhere, including parts of the U.S., but it does seem like more of the complaints are coming from outside the U.S. Dave starts to wonder if maybe his strategy of Focusing On The Back End with load generators in a nearby data center might be giving him a biased (unrealistically optimistic) measurement of the website performance.
He does a Global Last-Mile Load Test using mobile devices on WiFi connections at end-user locations all over the world, as shown in the Center panel. And now the problem is evident. Many users are experiencing response times much longer than 1.5s. The SLO requirements are NOT MET, as shown in the Center part of the figure, when tested in this realistic, unbiased way. For the first time, Dave is really measuring the response times experienced by the users.
Dave meets with the VP Engineering. They realize they have had an underperforming website for the last 5 months. They decide to bite the bullet and direct the developers to do those code optimizations and refactorings that they have been putting off for so long.
It takes 9 days to do all of those code changes and get everything functionally tested. And finally Dave runs another Global Last-Mile Load Test, and gets the results shown in the Right panel of the figure. The response times in the unloaded condition have been improved from about 1s to about 0.3s, and now the 95th percentile of all response times (including distant international users) are less than 1.5s as required by the SLO.
And there is another subtle side effect of that good optimization. The capacity in the 4th step of the ramp has gone up to about 130 requests/second. The website will withstand a larger spike in demand before failing, exceeding the SLO requirement.
This is a triumph of good solid engineering. The Performance Engineer measured the actual response times perceived by the user, which exposed a real performance problem, and required the Developers to make real improvements to the system to provide a great user experience.